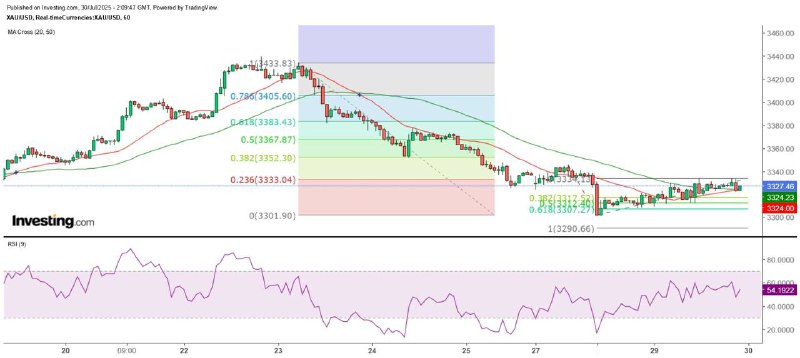
Gold price at 3330 is at the bullish and bearish offensive and defensive levels
"Gold Price at 3330 Becomes Key Support and Resistance Level" 30/7 10:05 am Finalized
After the US and the EU reached a trade agreement, they immediately began negotiations with China. Li Chenggang, the representative for international trade negotiations and vice minister of the Ministry of Commerce of China, said that within less than two days, both sides had in-depth, candid and constructive exchanges on major issues of mutual concern. This indicates that there is still a lot of room for negotiation and it is believed that it will be difficult to reach a specific trade agreement before August 1st. In terms of data, ADP will release the July private sector job changes tonight, with an expected increase of 77,000, reflecting the labor market starting to deteriorate. This could be an excuse for investors to sell the US dollar, thereby stimulating the rise in gold prices. However, the focus is still on the Federal Reserve's interest rate decision and the release of the July non-farm payroll report on Friday.
Yesterday, the fluctuation range of gold prices narrowed significantly. It is believed that investors are waiting for the Federal Reserve to announce the interest rate decision and a series of US economic data. From the four-hour chart, the spot gold price rose to a high of $3,334 yesterday, indeed encountering the resistance at $3,340 mentioned yesterday. If observed from the one-hour chart, the immediate resistance for gold is at $3,330. In other words, the actual high of gold prices is close to the median of the lower and higher time frame resistances. However, looking at the closing price of gold on the one-hour chart, it did not close above the top of the large bearish candle on July 28 at $3,330, nor above the top of the large bearish candle on the four-hour chart at $3,338. Therefore, which time frame's technical signals to refer to seems to be entirely dependent on investors' risk tolerance.
The daily chart forms a medium-term adjustment pattern.
From the hourly chart, the gold price has shown the initial formation of a descending flag pattern since July 28th. In the short term, it is inclined to take $3,330 as resistance, with a greater chance of a downward movement. Although the gold price reached a high of $3,333 in the Asian session this morning, it failed to close above $3,330 on the hourly chart and then dropped sharply to the $3,321 level. Using the Fibonacci extension to calculate the movements on Monday and Tuesday, coincidentally, if the gold price reaches the 100% extension level, the target is the same at $3,290, indicating that this level is a strong support for the gold price within the day. The resistance for a rebound within the day is expected to be $3,370. Additionally, investors should note that the gold price has closed below the 50-day SMA ($3,343.5) for three consecutive trading days on the daily chart, and the 20-day SMA ($3,344) is also overlapping with the 50-day SMA and moving downward. Overall, a mid-term adjustment pattern is being formed.
The above content is for reference only and does not constitute investment advice.
MTF Special Analyst Zheng Guangfu
Previous Article Next Article


 Whatsapp
 Telegram
