


 Whatsapp
 Telegram
Gold prices are expected to consolidate today
Gold prices are expected to consolidate today. 09:40 am, August 8th, completed
The World Gold Council released a report on the US gold demand trend in the second quarter on August 6th. It mentioned that the overall gold demand in the US decreased by 34% quarter-on-quarter to 124 tons, but still increased by 110% year-on-year, mainly due to a large amount of funds flowing into gold ETFs in the first half of the year. As for consumer demand, the demand for jewelry, gold bars and gold coins decreased by 24% year-on-year to 39 tons. Among them, the demand for jewelry has been declining for three consecutive years, decreasing by 7% year-on-year to 30 tons in the second quarter. In contrast, the high gold price led to a 49% quarter-on-quarter increase in the total value of jewelry demand to 3 billion US dollars, and a 30% year-on-year increase. However, the demand for gold bars and gold coins dropped by 53% year-on-year to 9 tons, the lowest since the fourth quarter of 2019, which led to a 35% year-on-year decrease in the total value of investment demand to 929 million US dollars.
Demand for gold ETFs continues to rise.
Gold ETFs listed in the US increased their holdings by 70 tons in the second quarter and 203 tons in the first half of the year, bringing the total holdings to 1,785 tons at the end of the second quarter, with a total value of 189 billion US dollars. In terms of the proportion of investment demand, gold ETFs accounted for 70% and 56% in the first and second quarters respectively; jewelry demand for gold accounted for 12% and 24%; technical applications accounted for 9% and 12%; and demand for gold bars and coins was 8% and 7% respectively. It can be seen that gold ETFs are the main driving force supporting the gold price.
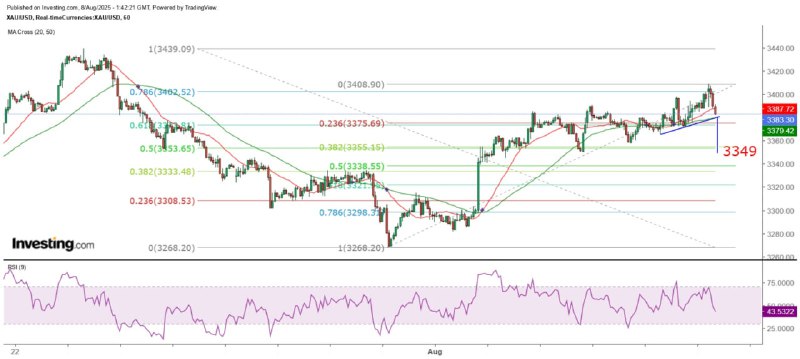
Yesterday, the gold price movement was in line with my prediction. After breaking through the lower trend line of the narrowing triangle in the early Asian session on the hourly chart, it consolidated for four consecutive hours at the low of $3,371.7, close to the bottom of the large bullish candle that broke through at $3,370.2. It then rebounded and reached a high of $3,397.5 in the early European session, also close to the measured upside target of $3,399. Although it later pulled back sharply, the low was only $3,371.9, and it climbed again, approaching $3,402 at the end of the New York session.
$3,365 remains a strong support.
Spot gold prices rose to $3,408.9 in the early Asian session today but quickly retreated and once fell below $3,385. From the hourly chart, it can be seen that since the strong upward breakthrough on August 1st, the gold price has maintained an upward trend. However, it should be noted that if it breaks through the support of the ascending channel on the hourly chart (currently around $3,380), the downward target will point to $3,349. Currently, the 50-day SMA is slightly below $3,350, so it is expected that this line will become an important support level for the short-term adjustment of the gold price. However, this is a more pessimistic view. I estimate that the gold price is likely to fluctuate within yesterday's range today, that is, it will still hold above $3,365 and launch an offensive on Monday to challenge $3,450 before a more significant adjustment.
The above content is for reference only and does not constitute investment advice.
MTF Special Analyst Zheng Guangfu
Previous Article Next Article


