
 en-US
en-US 

 Telegram
 WeChat


The gold price is ready to embark on a strong upward movement in three waves.
Gold Market Analysis: "Strong Upside Wave 3 Could Emerge at Any Time"
October 13, 2026, 10:28 AM (Completed)
Yesterday, gold prices failed to hold above $4,200 and instead declined steadily from early Asian session highs, only recovering slightly after stabilizing at $4,154.85 upon New York market open. Although the price action fell short of expectations, this was not without reason. First, U.S. lawmakers strongly urged Trump to reverse his decision to purchase diesel from Russia. Second, oil prices did not drop significantly in response to the news. Moreover, markets appear more focused on the future direction of U.S. interest rates than on short-term factors favorable to gold. As such, gold’s movement hinges entirely on how the market interprets the news about U.S. purchases of Russian oil.
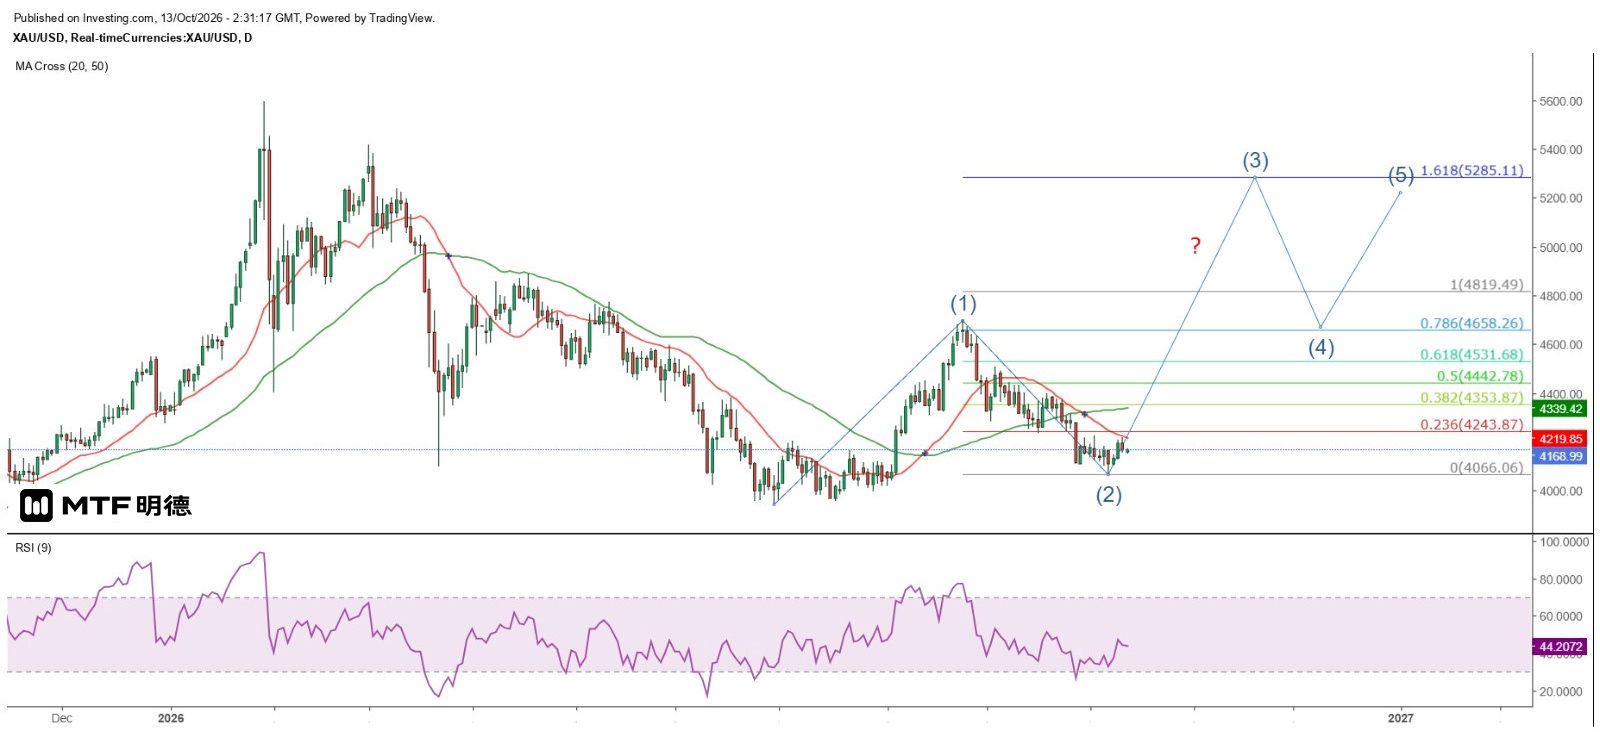
From a technical standpoint, yesterday's high reached $4,217.47—less than $10 below the 20-period SMA on the daily chart ($4,226)—marking the closest approach to this moving average since September 24. This indicates that the 20SMA still presents a significant resistance level. Investors might question whether breaking through this level is really so difficult. However, those with genuine intent understand that attempting to breach such resistance requires careful planning rather than merely pushing past it. If there is no strong buying support above this level—or if heavy selling pressure accumulates—attempting to drive prices higher by artificially inflating averages could place traders at serious risk.
In contrast, taking advantage of positive news to sell off and gradually accumulate positions at lower levels allows for building momentum before launching an upward move, which produces far better results. In fact, gold only briefly dipped below the minor Gann angle at $4,160 before rebounding. On the hourly chart, the pullback from yesterday’s high represented just over 38.2% of the gains seen since last Wednesday. Even if the correction reaches 50% at $4,141.9, it would still reflect robust underlying bullish momentum. Looking at the daily chart, counting from last week’s low at $4,066.06, the accumulated retracement exceeds 78.6% of the rally since June 30—a highly significant Fibonacci ratio.
Although I remain cautious, according to Elliott Wave theory, gold may have already completed its intermediate corrective wave 2 and is now poised to enter a powerful third wave upward. Under this scenario, gold could rise to $5,285.11 in the medium term. Investors should watch closely: once gold breaks above the daily 20SMA and closes above it for three consecutive trading sessions, the likelihood of a sustained medium-term uptrend increases dramatically.
The above content is for reference purposes only and does not constitute investment advice.


