
 en-US
en-US 

 Telegram
 WeChat

2025-11-18
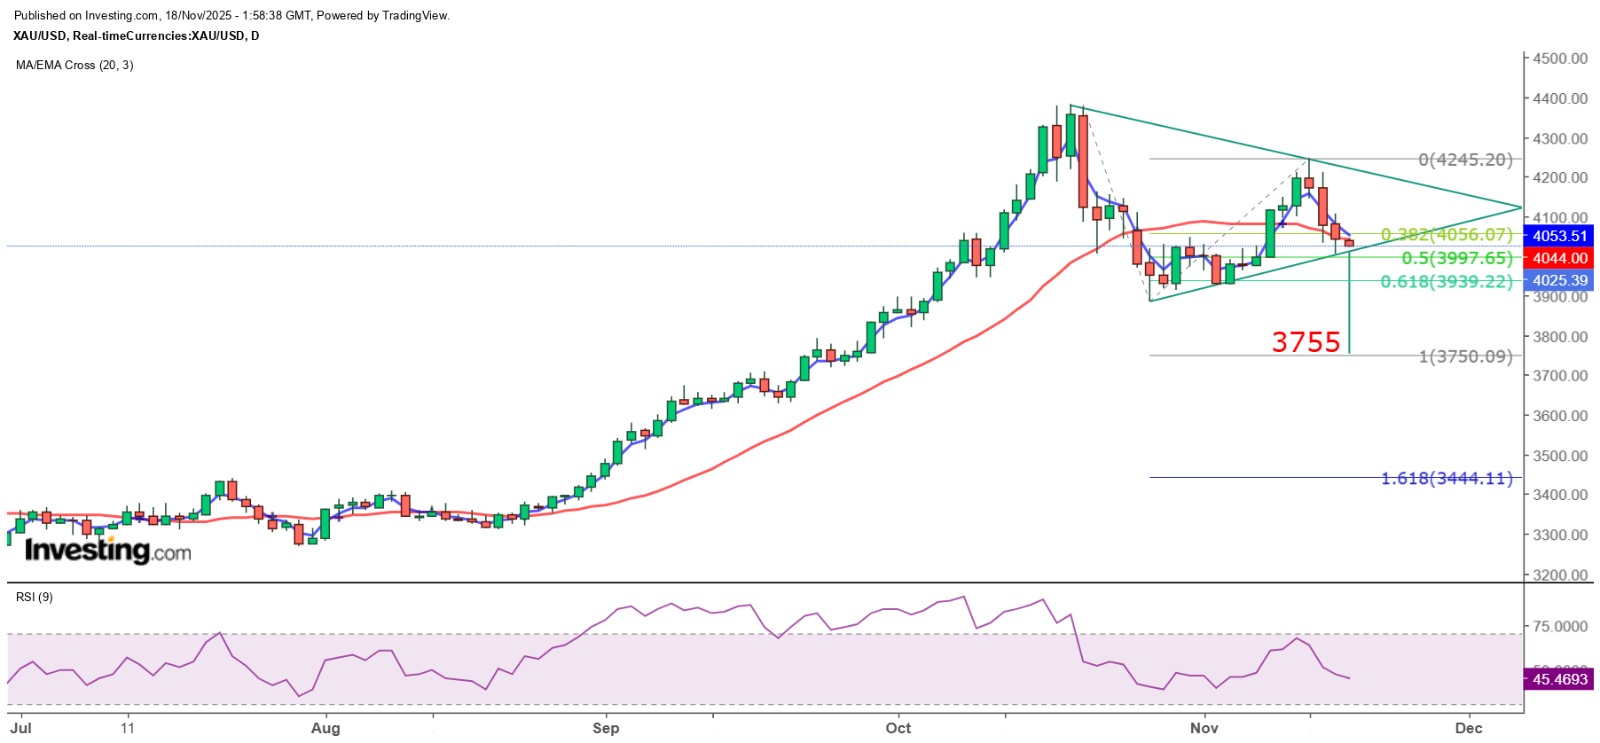
"Risk of Gold Price Falling Below $4,000 Rises" 18/11/2025 9:55 Completed Gold prices were weak yesterday. They fell below $4,060 in the midday Tokyo session and bottomed out at $4,049.81 before rebounding. They continued to rise above $4,060. It was thought that the $4,060 level could be held, but after the London close, they dropped to $4,052.56. They rebounded to near $4,081 but then weakened again and plunged sharply in the late New York session, even breaking through the $4,010 Gann 90-degree angle. Fortunately, gold prices found strong support at the $4,000 mark and have since held steady at that level and continued to rise. Sharp fluctuations are a precursor to a trending market. However, the spot gold price was extremely volatile in the Asian market this morning. After hitting a low of $4,027.54, it rebounded repeatedly but fluctuated rapidly within a range of $7 to $10, showing a strong possibility of a bullish-bearish double-sided attack before a trend emerges. From the 5-minute chart, the gold price consolidated above the 20SMA (4036.9) but then broke below it. Looking at the trend since the London close yesterday, it has formed a triangle pattern waiting to be broken. From the hourly chart, the gold price is still constrained by the 20SMA (4061), and a large bearish candle with a top at $4,065.1 has emerged. It may be difficult for the price to rise to $4,060 within the day. Overall, the fluctuation range of gold prices has shifted down to between $4,060 and $4,010. Unless it breaks above and closes above $4,065, $4,010 is likely to be tested again. If it falls below this level, it will become a strong resistance, and the gold price is likely to test $3,910. From the daily chart, the gold price has formed a lower high. Measured by the Fibonacci extension line, if the extent reaches 100%, the gold price will fall to $3,750.09, which is very close to the TD line's measured decline target of about $3,755. Therefore, it is judged that the short and medium-term trend of the gold price remains weak. The high of $4,055.46 made in the Asian market this morning is also close to the highs of $4,056.38 and $4,052.56 made in the early Tokyo afternoon and after the London close yesterday. It is questionable whether the gold price can rise to $4,060 today, while the risk of breaking below the $4,000 mark is gradually increasing! The above content is for reference only and does not constitute investment advice.
2025-11-18
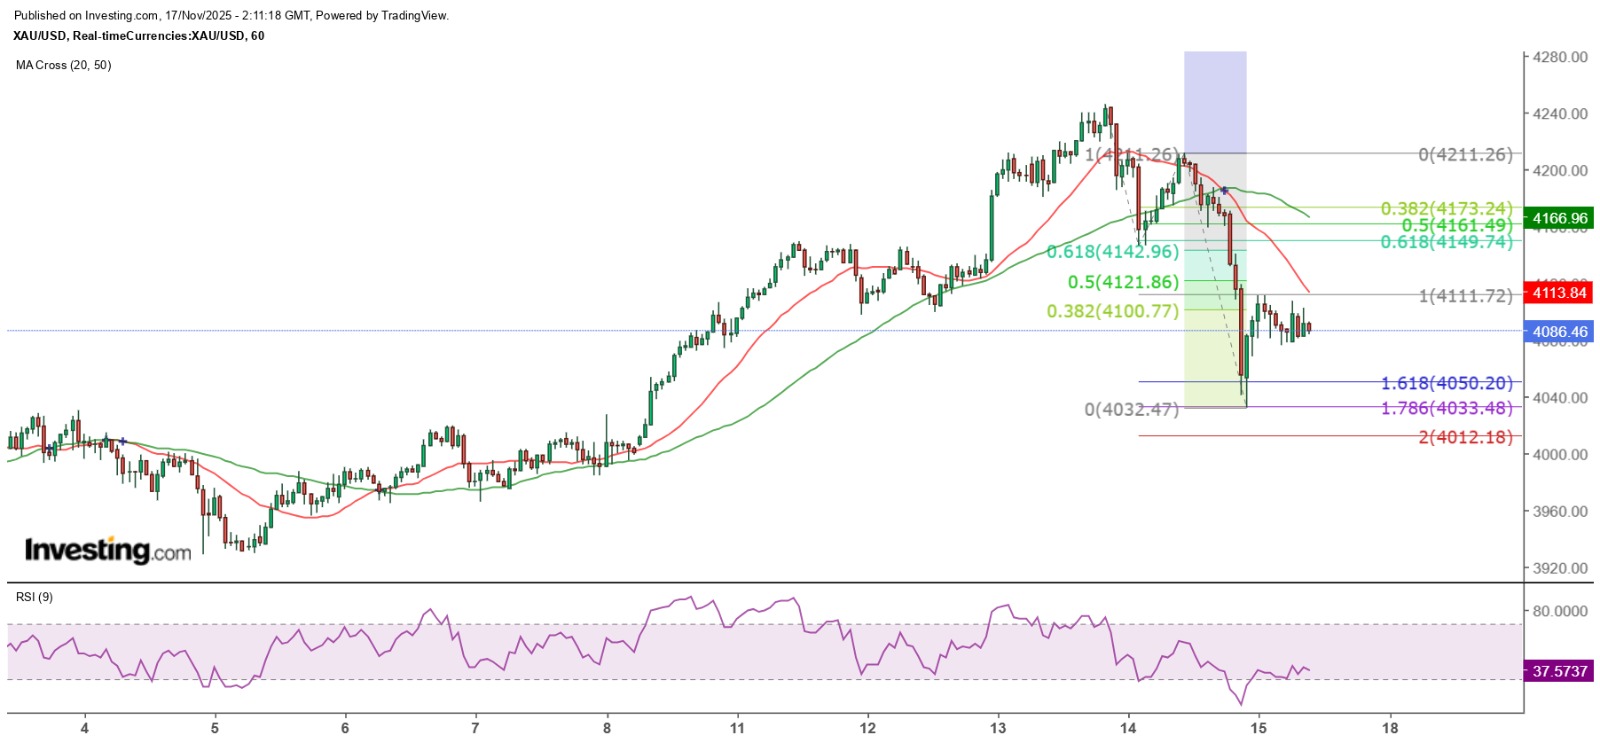
Gold prices remained weak intraday on 17/11/2025 10:09. Last Friday, the price of gold plunged sharply, with the spot gold price fluctuating by more than 179 US dollars in a single day and closing down by more than 2%. Is gold a safe-haven asset at any time and at any price? The answer is now quite clear. Therefore, investors should not simply regard gold as a safe-haven or inflation-hedging tool. Low real interest rates in the US make it hard to cut interest rates further. Although the Federal Reserve cut interest rates by 25 basis points in October, two council members dissented. Trump-appointed council member Milan suggested a 25 basis point cut, while another council member, Schmid, advocated for maintaining the interest rate. The U.S. inflation rate rose back to 3% in September. From an inflation perspective, there is not much justification for the rate cut. However, the Federal Reserve has shifted its focus to the weak job market. I think this is a bit excessive. The U.S. and the global economy have entered the AI era, and many jobs will inevitably be replaced. Unless job seekers transform, it is unlikely for them to return to jobs that have been or will be replaced by AI. Although the rate cut can squeeze out a little bit of consumer spending power, it has no effect on the price increase caused by a ten to tens of percent increase in tariffs. Currently, the real interest rate in the U.S. is less than 1%. It is quite normal for Federal Reserve Chair Powell to be uncertain about whether to cut rates in December. Asset prices that have been overvalued naturally need to adjust. Last Friday, the spot gold price dropped to a low of $4,032.47, even lower than my expected $4,046.21. Today, the gold price opened lower in the early Asian session and then rose. In the short term, $4,078 and $4,081 are seen as strong support levels. However, resistance is expected above $4,100. After the London close last Friday, the gold price reached a high of around $4,111 but faced strong pressure. Therefore, for the time being, it is judged that $4,111 is an important resistance level for the day. In other words, if the gold price breaks through this level, it is likely to trigger stop-loss orders or program buying, pushing it even higher. $4,110 is expected to be the intraday resistance. From the hourly chart, gold prices are constrained by the 20SMA (4119). After reaching a high of $4101.91 this morning, they were pressured, indicating that the first resistance was encountered at the 38.2% retracement level of the biggest decline since last Friday (4100.77). If the rebound reaches 50% and 61.8%, it could reach $4121.86 and $4142.86 respectively. The former is slightly above the 20SMA, while the latter is near the low point of last Thursday. Both are obvious technical resistances. Even though the US is expected to release the September non-farm payroll report this Thursday, the data is already lagging. Any market reaction to the deviated data will be short-lived. However, if the data shows an increase in employment positions, or even an increase of more than 100,000, gold prices will surely fall sharply again. Moreover, the daily chart of spot gold has shown a lower high, strengthening the signal of a decline. Spot gold is expected to maintain a weak trend within the day, and at most, it will fluctuate between $4110 and $4060. If it breaks down, it is expected to fall to around $4010 before finding support. The above content is for reference only and does not constitute investment advice.
2025-11-17
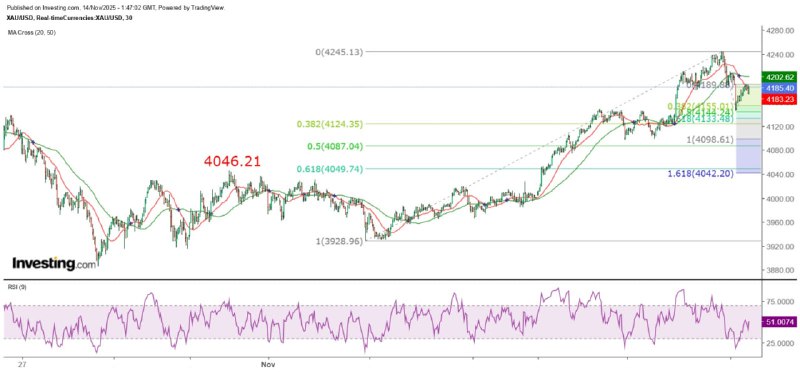
Gold prices are expected to remain under pressure intraday. 14/11/2025 9:46 Finalized. US President Trump signed a funding bill to provide funds for the federal government until January 30, 2026, ending the 43-day shutdown. However, this was expected. To exaggerate a bit, from the first day of the shutdown, the market expected it would not last for a long time, such as a year. Nevertheless, the shutdown led to many economic data not being released. The White House stated that the October non-farm report and consumer price index might never be released. Of course, without conducting statistics due to the shutdown, how could there be any data to release! On the other hand, the US stock market plunged last night. One of the reasons was that the valuation of the AI industry was too high. Also, a series of economic data were released simultaneously after the government resumed normal operations. The possibility of the Federal Reserve cutting interest rates in December has decreased, causing uncertainty about the future. Moreover, it is the fourth quarter and Thanksgiving is approaching. All these factors led to a profit-taking sell-off in the US stock market. To me, this was expected. I can only say, "Finally, it's here!" Virtual currencies also dropped sharply. Bitcoin fell below the $100,000 mark. The price of gold also plunged sharply last night, with spot gold hitting a low of $4,145.59. It then gradually recovered and reached a high of $4,189.88 in the early trading in Tokyo today. However, it dropped again later. The safe-haven role of gold is under consideration. Now is the moment to test whether gold can still serve as a safe-haven asset in the financial market regardless of its price level. In the past, it could when the price was relatively low. But can it still do so when the 9RSI on the monthly gold price chart exceeds 95? Or will it be cashed in at the peak as well? The answer will soon be revealed! Support will only be provided when the lowest price reaches 4046. Gold prices plunged sharply in the New York midday session yesterday, immediately expanding the daily range to nearly $100. Although gold prices reached a high of around $4,245 yesterday and fluctuated mostly between $4,210 and $4,260 for most of the day, the sharp drop pushed them back below the strong resistance level of $4,210. Despite a significant decline in the US stock market last night, gold prices did not rise significantly. Instead, after approaching $4,190, they formed a small double top and retreated. In the short term, gold prices showed a single-day reversal yesterday, and it is expected that they will continue to be under pressure today. Using the Fibonacci extension line to measure the movement since yesterday's high, the short-term target for a decline is $4,098.61. If the movement since October 28 is regarded as waves 1, 2, and 3, and assuming wave 3 has ended, the maximum adjustment range suggests a decline target of above but close to $4,046.21. From the perspective of Gann's square, the gold price is likely to fluctuate within the range of $4,210 to $4,160 at most. The above content is for reference only and does not constitute investment advice.
2025-11-14
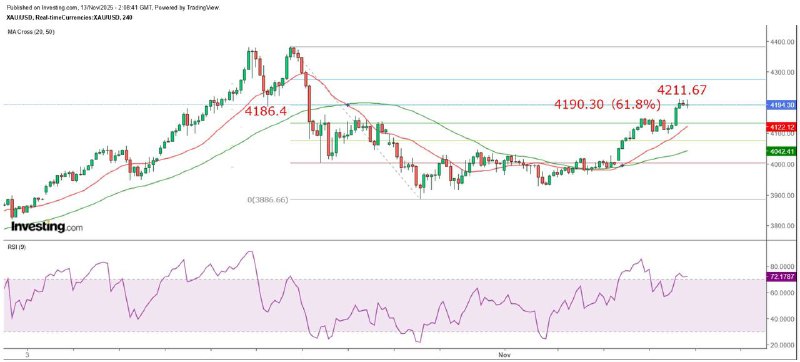
"Gold Price Faces Strong Resistance at $4,210" 13/11/2025 10:04 Finalized Yesterday, the gold price suddenly rose sharply in the New York morning session. The spot gold price broke through the long-standing resistance level of $4,140 and reached a high of $4,211.67 in the New York midday session before stabilizing. The reason for this can be attributed to the announcement by the president of the Atlanta Federal Reserve, Raphael Bostic, that he will retire at the end of February 2026. The reason is that he is regarded as a hawkish Fed official who has often supported maintaining interest rates or raising them to control inflation. After his retirement, Trump is likely to appoint someone who supports interest rate cuts to fill the vacancy, adding a dovish official to the Fed. And when Powell's term ends in May next year and he does not seek reappointment, Trump will surely appoint someone with a dovish stance as the Fed chair, making monetary policy more dovish. This is the reason for the sudden rise in the gold price. Financial markets are subject to human influence. As the gold price and other financial asset prices are increasingly dominated by human factors (Trump), the trend is becoming more and more irrational. Once Trump indicates that he has no intention of influencing the independence of the Federal Reserve, the gold price is bound to fall sharply, which must be guarded against. On the other hand, even if dovish officials are appointed to the Federal Reserve, if the US inflation rate remains above 3%, on what grounds can the official support a rate cut? October's CPI is expected to influence gold prices. Yesterday, the gold price performed exactly as I predicted. After breaking through $4,150, it challenged $4,210. The gold price reached as high as $4,211.67 yesterday, achieving the target. However, $4,210 is located at the 180-degree angle of Gann's square, which is a strong resistance level. As a result, after breaking through this level, the gold price fluctuated and fell back. In the early Asian session today, it dropped as low as $4,180.17 and has since been fluctuating within a range of about $10. Currently, the gold price is still above the neckline of the double top on the hourly chart at $4,186.4. I estimate that there will be intense battles between bulls and bears. However, unless the gold price significantly breaks through $4,210, the risk of a decline remains high. Therefore, I temporarily judge that the gold price will fluctuate between $4,210 and $4,160. The release of the US October CPI tonight will be the main factor influencing the short-term trend of the gold price! The above content is for reference only and does not constitute investment advice.
2025-11-13
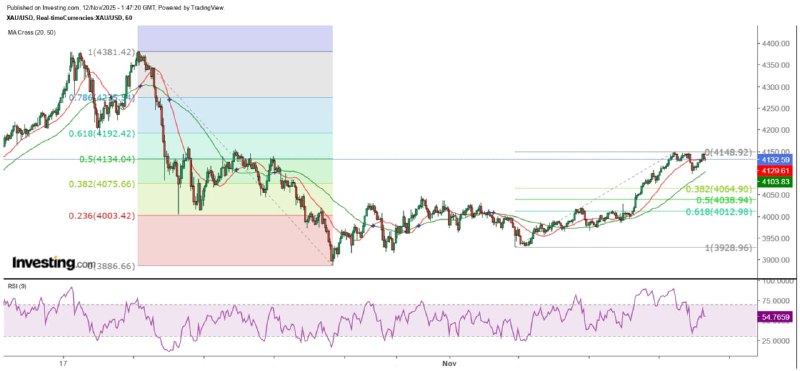
"Gold Price Held Below 4150, Continues to Adjust" 12/11/2025 9:47 Finalized Yesterday, gold prices reached a high of $4,148.92 in the early part of the Tokyo midday session before entering a sideways pattern. In the early part of the European session, they twice fell to the $4,125 level, which clearly provided support, and then rebounded to $4,145 but encountered resistance. Even when the New York session began, the sideways range only expanded to between $4,146 and $4,124. This was likely due to the absence of economic data releases in the United States, causing the market to fluctuate within a narrow range. Near the New York midday session, gold prices finally broke below the bottom of the sideways range, hitting a low of $4,097.26 before gradually recovering. They ultimately closed at the $4,126 level. The Hengxing Market is favorable for short-term trading. In the face of the narrow fluctuation of gold prices, it is extremely favorable for short-term speculators. There is no need to worry about a strong trend market after the gold price breaks through the resistance or falls below the support level. As long as they sell near the top of the horizontal range and buy near the bottom, setting a stop-loss of a few dollars is sufficient. By operating in this way back and forth, the profits obtained may be greater than the range of the horizontal movement! There are no significant data releases in the US tonight either. Market focus is expected to shift to the release of the October CPI on Thursday. However, as the government remains shut down, it is uncertain whether the CPI will be released on schedule. Even if it is released on time, its accuracy is also in question. Nevertheless, some institutions predict that the overall CPI for October will rise by 0.4% month-on-month and 3.1% year-on-year, while the core CPI will increase by 0.3% month-on-month and 3.1% year-on-year. Such a scenario would indicate a further rise in inflation, reducing the possibility of a rate cut in December and being unfavorable for gold prices. $4,039 is expected to offer support. This morning, gold prices continued to rise on the back of the previous day's rebound, but after reaching a high of $4,145.5, they were held back and fell. From the hourly chart, it can be seen that gold prices have made three attempts to break through $4,150 but have not succeeded yet, so this level can be regarded as a short-term important resistance. On the contrary, if it breaks through this level, it is expected that gold prices will challenge $4,210. However, gold prices failed to rise further. Technically, this is because they have rebounded by 50% of the largest decline since the historical high on October 21. In terms of news, the main reason is that the Federal Reserve may not cut interest rates in December. Secondly, the US CPI data to be released on Thursday this week may reflect rising inflation. Therefore, it is expected that the short-term probability of gold prices continuing to decline is relatively high, and it is expected to find significant support around $4,039. The above content is for reference only and does not constitute investment advice.
2025-11-12
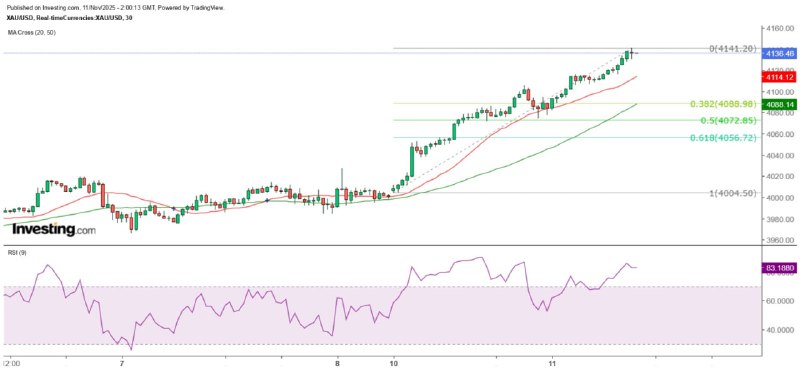
"Gold Price Intraday Adjustment Target: $4,072" 11/11/2025 9:59 Completed Yesterday, the spot gold price broke through the top of the horizontal range on the hourly chart and rose repeatedly. This morning, it reached a high of $4,141.03 before slightly pulling back. From the daily chart, the gold price has returned above the 20-day SMA ($4,081.6). The high even broke through the 50% retracement level of the largest decline since the record high on October 20, which is $4,134. The gold price is now at a critical juncture. If it can hold above $4,134.04 smoothly or even rise further to the 61.8% retracement level of $4,192.42, the possibility of the gold price challenging the historical high cannot be ruled out. In the short term, the fluctuation range of gold prices has shifted upward to between $4,110 and $4,160. However, $4,160 is not a significant resistance level. $4,210 is at a 180-degree angle. For gold prices to reach this target, they must first break through the previous double top neckline on the hourly chart at $4,186 and $4,192.42. Therefore, even if gold prices break through $4,160, the resistance they encounter in further climbing will be greater. The end of the suspension is not favorable for gold prices. The US Senate passed a temporary funding bill through a procedural vote, extending federal government funding until January next year. The end of the shutdown effectively boosted market confidence, causing the safe-haven role of gold in this regard to disappear. Of course, the market still has plenty of reasons to find other risk factors to continue pushing up the gold price. For the time being, the gold price touched $4,141 and then fell in a double top pattern on the 1-minute chart, hitting a low of $4,132.12 before rebounding. The subsequent rebound failed to reach the 20SMA (4138) on the 1-minute chart and further dropped to $4,130 before seeing a strong rebound and breaking above the 20SMA. However, as emphasized yesterday, be cautious of a correction wave in gold prices today. Nevertheless, it is still expected that $4,000 will be a strong support level, with a 50% retracement target at $4,072.85. The above content is for reference only and does not constitute investment advice.

2025-11-11
Gold prices are expected to fluctuate above $4,000 this week. 10/11/2025 10:06 Finalized Good news came as the US government shutdown entered its 40th day. It was reported that the US Senate is expected to move forward with a vote on a bill that has already passed the House of Representatives. However, the Senate will revise the bill to provide short-term funding for the federal government until January 2026. It is said that the bill has received enough support from Democratic senators. Once passed, it will be submitted to President Trump for signature, which is expected to take several days. Trump also believes that the end of the shutdown is near. The expected end of the shutdown is likely to boost gold prices. News reports have spurred gold prices to rise in the early Asian session this morning. After opening slightly above the psychological level of $4,000, gold prices fluctuated and rose. Despite encountering resistance at $4,018 in Tokyo, there was no significant pullback. Instead, it consolidated sideways and eventually broke through that level, reaching a high of $4,053.13 for the day. If the US government ends the shutdown, it should be regarded as good news. Investors' risk appetite should increase and the demand for safe-haven assets should decline, which is unfavorable for gold prices. However, on the other hand, the resumption of operations by the US government means that economic data will be released as usual. The market may be concerned that the non-farm payroll data for September and October to be released by the US Department of Labor later will reflect a deterioration in the labor market, increasing the probability of the Federal Reserve cutting interest rates in December. In addition, the US will release the CPI for October this Thursday. US Treasury Secretary Mnuchin previously stated that with the decline in oil prices, the CPI inflation rate is expected to fall. These two factors both increase the probability of the Federal Reserve cutting interest rates. It is not surprising that the gold price, which has been constrained at around $4,000 recently, has broken through this level. Be cautious of a possible adjustment on Tuesday. When the gold price is plotted within the Gann Square, it becomes clear that it is currently fluctuating within the range of $4,010 to $4,060. It is expected that $4,000 has become a strong short-term support level, and the high of $4,053.13 is also below the upper limit of the Gann Square range at $4,060. On the other hand, from the hourly chart, it can be seen that the high made by the gold price this morning is the highest since October 27th. In other words, the gold price has broken through the top of the horizontal range on the hourly chart, which is expected to provide impetus for a further short-term rise in the gold price. However, it should be noted that the market trend on Monday often reflects the news over the weekend, and Tuesday usually sees a correction to Monday's trend. Therefore, be cautious of a possible pullback on Tuesday. Nevertheless, the range of $4,020 to $4,000 can be regarded as an important support zone, and the gold price is expected to fluctuate above $4,000 this week. The above content is for reference only and does not constitute investment advice.
2025-11-10
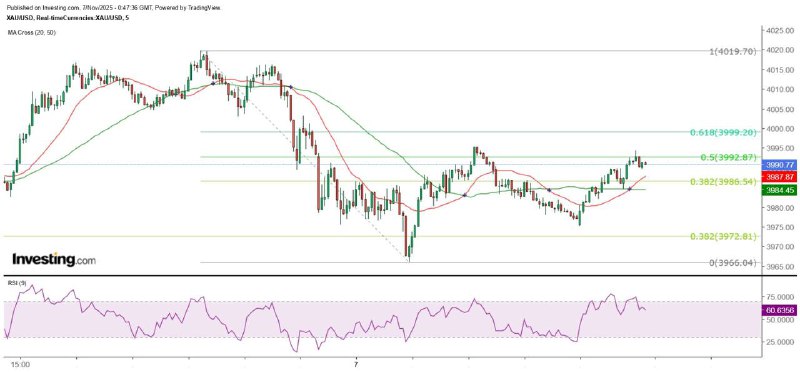
"Unusual Fluctuations in Gold Prices Signal a Breakthrough Ahead" 7/11/2025 8:44 Completed After entering the Tokyo afternoon session yesterday, the gold price exhibited highly volatile performance. It was clearly visible from the 1-minute chart that whenever the gold price rose to $3,990, it encountered strong selling pressure, which rapidly pushed it down by about $5. However, at the lower levels, there was also strong buying that pushed the gold price back up to $3,990. It is evident that the gold price is in a state of battle between bulls and bears. I believe that a major decline in the gold price is about to occur. However, when the London market opened, the gold price did not fall but rose instead, breaking through $3,990 and regaining the $4,000 mark. Even the 90-degree angle of the Gann Square at $4,010 was broken. Although there was some adjustment afterwards, the support at $4,000 was extremely strong. After reaching a low of $4,005, it climbed again and approached $4,020 just before and after the opening of the New York market. $4,000 gained and then lost However, after the New York market opened, selling pressure emerged. The gold price dropped below $4,003 and then resumed its upward trend. However, it encountered resistance at $4,016 and the trend continued to decline. The gold price fell back below $4,000, erasing the gains of several dozen dollars. It bottomed out at $3,966 in the New York midday session before rebounding again. At the end of the trading day, it rose to around $3,995 but failed to challenge the $4,000 mark again and fell once more. This morning in the early Asian session, it started to climb from the low of $3,975 but was temporarily constrained at $3,990. The daily chart of gold prices remains in a sideways range. The hourly chart is currently constrained by the 20SMA (3994.8). The recent volatile movement of gold prices actually reflects a strong bearish signal on the daily chart and the loss of the key psychological level of $4,000, which has shaken investors' confidence. The strategy is no longer to buy on dips as before. Especially with the possibility that the Fed may not cut interest rates in December, the easing of Sino-US trade frictions, the approaching end of the year, and the fact that spot gold prices have risen by more than 52% this year, a greater momentum is needed for further gains in the future. $3,960 is an important intraday support level. In the short term, the probability is high that the gold price will fluctuate below $4,010, with $3,960 likely to be an important support level for the day. The abnormal fluctuations from the early Tokyo midday session to the opening of the London market yesterday cannot be ignored. This is similar to what I witnessed on the last trading day of March 2000 when the USD/JPY experienced rapid fluctuations within a narrow range near the European midday session, followed by a sharp decline. Therefore, I judge that if today is a turning point for the gold price, the chance of a downward reversal is greater. Today is also the last trading day of the week, so it is not surprising if the gold price is preparing for a major breakthrough. Of course, I may be wrong, and risk management is essential for every mature investor! The above content is for reference only and does not constitute investment advice.
2025-11-07
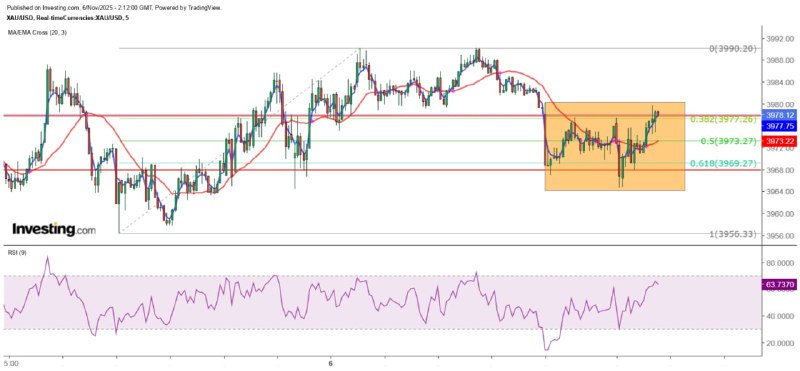
"Gold Price Sideways Movement Preparing for a New Downward Wave" 6/11/2025 10:07 Completed Recently, the volatility of gold prices has intensified. For short-term speculators, whether they follow the buying or selling trend, the risk of stop-loss is equally high. Yesterday, the ADP in the United States announced that the number of private sector jobs in October increased by 43,000, exceeding the expected 28,000. The job change in September was also revised upward from a decrease of 32,000 to a decrease of 29,000. What investors should note is that the data shows that only small and medium-sized enterprises with fewer employees have cut jobs, with 15,000 and 25,000 respectively. However, small and medium-sized enterprises with more employees have added 5,000 and 3,000 jobs respectively, and large enterprises with more than 500 employees have added 74,000 jobs. Therefore, although the US labor market is still weak, it is still expected to gradually recover. Gold prices officially fell below $4,000. However, the gold price did not react much. After a slight pullback, it continued to rise and reached the $3,990 level twice, shortly after the London market closed and towards the end of the New York session. It then fell back in a double top formation. This morning, in the early Asian trading session, it dropped sharply to the $3,966 level before rebounding. It twice rose to the $3,977 level but was unable to break through and fell back. It then plunged sharply to $3,964.66 before rebounding above $3,970. Overall, the gold price fluctuated repeatedly. Yesterday was the first time since it broke below the 20-day SMA (currently around $4,082) on October 27 that it failed to reach the $4,000 mark. The volatility of the gold price has intensified, with a "double kill" flavor, meaning that both weak long and short retail investors are being eliminated, and a new trend market is about to emerge. There is strong resistance at $3,980 within the day. In the short term, there are two major resistance levels for gold prices within the day, which are $3,970 and $3,990. Meanwhile, $3,965 and $3,930 are the key support levels for the recent period. The broader range of fluctuation is between $3,915 and $4,046. From the hourly chart, the high points of gold prices are gradually declining. The top of the large bearish candle that broke down this morning at $3,980.09 can be regarded as an important resistance level for the day. Considering the daily fluctuation of gold prices is approximately $50, it is more likely that the price will test $3,930 within the day. Even if it breaks through $3,980, it will still face resistance at $3,990 and $4,000. Unless major players are determined to keep gold prices above $4,000, there is no need to take the risk. Investors should especially note that the longer gold prices remain sideways on the daily chart, the greater the potential for a sharp decline once a breakout occurs. If the price breaks below $3,886, it indicates the start of a new round of decline for gold prices! The above content is for reference only and does not constitute investment advice. MTF Special Analyst Zheng Guangfu
2025-11-06
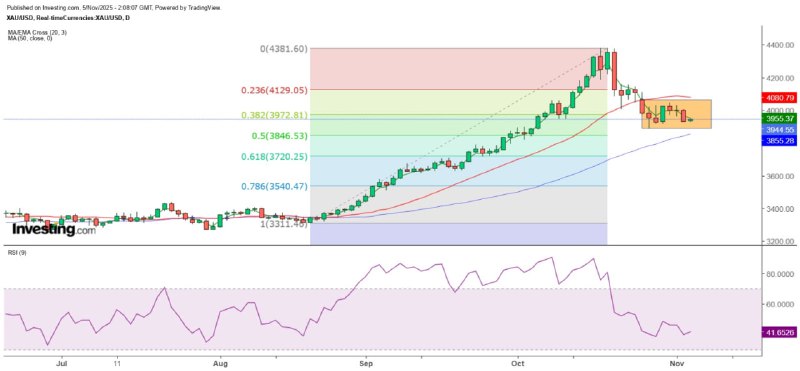
"Gold Price Falls Below 4,000, Downward Trend Continues" 5/11/2025 10:05 Completed Needless to say, everyone has witnessed the sharp drop in gold prices in the first half of the trading session in New York yesterday. Spot gold hit a low of $3,928.96, and then rebounded continuously. It rose to a high of $3,975.52 after the London market closed, but then fell again. This morning, in the early trading session in Tokyo, it dropped to a low of $3,930.23 and rebounded again, but was temporarily constrained by the psychological level of $3,950. However, the fluctuation range of gold prices has shifted down to between $3,960 and $3,910. After rebounding over 45 dollars from the day's low yesterday, gold lost almost all of its gains within a few hours, and the high was only about 25 dollars away from the 4000-dollar mark. This suggests that the 4000-dollar level has been breached, and it is unlikely that gold will return to this level within the year. The logic is simple: when you see gold no longer making new highs and instead retreating step by step, breaking through the 20-day SMA (4080.8) is a strong bearish signal. Investors become more vigilant, and as gold continues to fall and they must take action, the selling pressure on gold will only increase. Some investors may think that the sudden drop in gold is a shakeout or washout, but the rally in gold did not just start. It began as recently as September this year and as far back as October 2023. How long will the big players need to wash out before it's over? The $3,900 level is expected to be breached again within the day. Yesterday, I pointed out that the gold price breaking through the 4,000 mark in the early Asian market was not a good sign, and it also provided an answer to the question of whether it was a signal that the gold price was about to fall sharply again. Currently, the gold price is at its most vulnerable point, and it is highly likely to fall below 3,900 US dollars today. This level was breached on October 28th, when it dropped to a low of 3,886.66 US dollars before rebounding. What investors need to pay attention to now is the trend on the daily chart. $3,500 is unlikely to be the adjustment low point. After gold prices broke through the 20-day SMA on October 27th, they have gradually formed a sideways consolidation pattern. Currently, they are close to the bottom. Using a simple measurement method, gold prices could fall to the $3,700 level. The $3,720.25 mark represents the 61.8% retracement target of the largest increase since August 20th and may offer temporary support. The previously mentioned $3,500 is unlikely to be the ultimate adjustment low for gold prices. If the 2023 increase since October is adjusted by 50%, gold prices would fall to $3,050.85. Therefore, it is expected that only $3,000 can provide significant support for gold prices. Additionally, as we enter November, the 9RSI on the monthly chart of gold prices has dropped from 94 to 89, but it still remains in a severely overbought state. The adjustment in gold prices has not yet ended. Manage risks well! The above content is for reference only and does not constitute investment advice. MTF Special Analyst Zheng Guangfu
2025-11-05
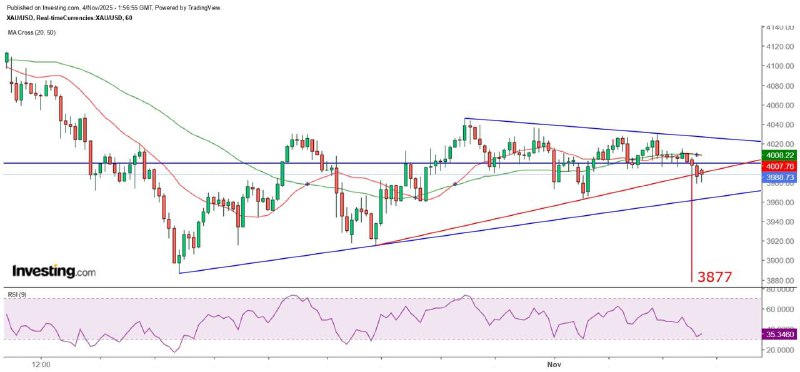
"Gold Price Short-Term Triangle Pattern Awaits Breakthrough" 4/11/2025 9:54 Completed Over the past two trading days, the volatility of gold prices has significantly narrowed. From the daily chart perspective, a short-term ascending flag pattern seems to be forming. However, gold prices remain below the 20-day SMA (currently around 4088), and the weekly chart shows that the bullish and bearish candles have given a bearish signal. Even though gold prices have repeatedly returned above the $4,000 mark, they can easily fall back below it. Gold prices fell below $4,000 near the London midday session yesterday, but rebounded after hitting a low of $3,993. They rose to a high of $4,030.59 before the London close, but then dropped again and fell below $4,000 once more, reaching a low of $3,995.59 before stabilizing. In the last hour before the New York close, they rose to $4,014.94, but then fell again, closing slightly below $4,002, which was essentially unchanged from the previous Friday's closing price. The Asian morning market's crossing of 4,000 points is not a good omen. This morning, gold prices plunged to $3,984.43 in the early Asian session before rebounding, but failed to reach $4,000. Subsequently, they fluctuated and declined. From the 5-minute chart, it is evident that gold prices are constrained by the 20SMA (currently around $3,990). I feel that yesterday's sharp drop was a prelude, and the range was only slightly more than $32. If this reflects that gold prices are seeking a direction to break through, the possibility of a downward development is relatively high. The recent significant fluctuations in gold prices have led some speculators to believe that it is a "washout". If this is true, the market is also likely to decline in the future. Judging from the timing of the gold price changes, today marks the first time since October that gold prices have fallen below $4,000 in the early Asian session. Last Friday, they dropped below that level during the midday Tokyo session. Could this be a signal that gold prices are about to fall sharply again? The short-term support level of $3,960 must not be lost. From the hourly chart, it can be seen that the gold price has formed a narrowing triangle since October 28th, indicating that the gold price is in a breakout pattern. Moreover, the gold price has broken through the TD ascending trend line, and the measured decline target is approximately $3,877. If the gold price fails to rise above $4,000 today, this level is likely to become a short- to medium-term resistance. In this case, the current gold price of $3,990 can be regarded as approaching the top. Analyzed by Gann angles, the current gold price is below $4,010, meaning the fluctuation range has dropped to $4,010 to $3,960. Therefore, $3,960 is a key support level. If it is breached, the secondary support level of $3,910 will be tested. The above content is for reference only and does not constitute investment advice. MTF Special Analyst Zheng Guangfu
2025-11-04
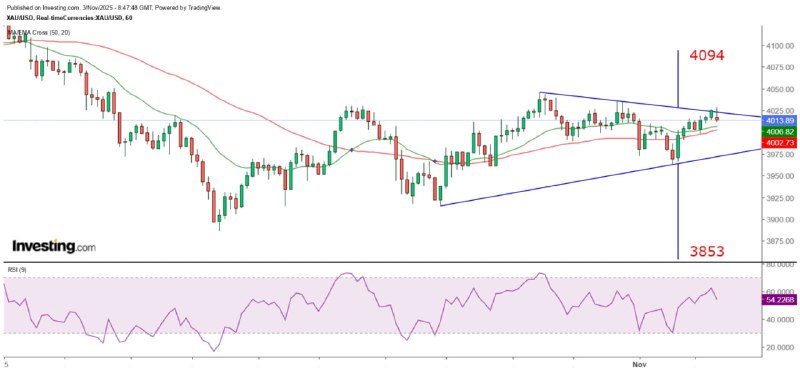
"Gold Price Trend Expected to Be Weak and Volatile" 3/11/2025 10:02 Finalized Gold prices opened lower with a gap on the first trading day of November and then fluctuated down to $3,962.92 before gradually recovering. Regardless of whether it can return above the $4,000 mark, it at least conforms to the pattern that gold prices have always fallen back below the thousand-dollar mark in the following month after breaking through it. From the perspective of Gann's Square, before gold prices rise above $4,000 or even break through $4,010, they tend to fluctuate between $3,910 and $3,960. However, $3,960 is not a major or minor resistance level, so if gold prices continue to rise, $4,110 is the first important resistance level. The technical outlook for gold prices remains bearish. From the hourly chart, gold prices peaked at $4,036.07 last Friday and then declined, showing a pattern of each wave being lower than the previous one. This morning's rebound is merely a recovery after forming the second trough. Besides the $4,000 mark, the 20SMA on the hourly chart ($4,004) is another significant resistance level for gold prices. Moreover, the top of the large bearish candle formed at the close of trading in London last Friday at $4,015.26 is also a crucial resistance level for gold prices in the immediate term. Looking at the daily chart, gold prices seem to be forming an ascending flag pattern, provided that they continue to hold above $3,915.17. However, technically, gold prices are currently below the 20-day SMA ($4,087.9), indicating a bearish trend until they regain and hold above the 20-day SMA. This week, it is expected to fluctuate between 3900 and 4000. After the meeting between the Chinese and US leaders in Busan, it has a positive impact on resolving the trade shock between the two countries. It is reported that the two sides may sign a trade agreement as early as this week. On the other hand, the shutdown of the US government departments has led to many important data not being released on time. Therefore, it is expected that the non-farm payroll report for October will not be released this Friday. In this case, the private institution ADP's release of the October private sector employment change data becomes an important employment report. Currently, the market expects an increase of 28,000, which is still a relatively low growth rate, but at least it is not a decrease! These factors are unfavorable for the gold price trend. Of course, there are other economic data released in the US this week, which are also expected to affect the gold price performance. Therefore, it is expected that the gold price trend this week will be mainly volatile and weak. If the ADP's employment position change returns to positive, the possibility of the gold price falling below $3,900 again this week is very high. Although gold prices recovered most of the lost ground this morning, they still dropped by about 10 dollars and saw selling pressure at the 4000-dollar mark. Measured by the TD line on the hourly chart, if gold prices break above the downtrend line, the upward target is approximately 4094 dollars. If they fall below the uptrend line, the measured downward target is about 3853 dollars. Before the release of the ADP's October employment report, gold prices are expected to be trapped between 3900 and 4000 dollars this week. If China and the United States announce a trade agreement later, gold prices are likely to fall below 3900 dollars. The above content is for reference only and does not constitute investment advice. MTF Special Analyst Zheng Guangfu
2025-11-03
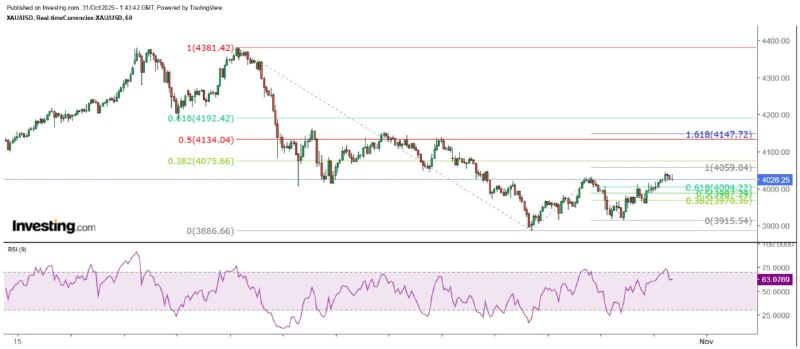
"Gold Price Approaches Short-Term Phase Top" 31/10/2025 9:42 Completed Today marks the last trading day of October. As previously mentioned, every time the gold price breaks through the $1,000 mark, it tends to fall back below it in the following month. Now, the $4,000 level was breached this month, meaning that the price is likely to fall back below $4,000 in November (whether it will rise again is another matter). From a daily chart perspective, yesterday's rebound was the strongest since the gold price started to decline from its historical high. If the gold price can hold above the significant Gann angle at $4,010, it may challenge the secondary resistance at $4,060 in the short term. After that, the 20-day SMA at $4,088 comes into play. Only if it can stay above this line will the chances of further increase in the gold price increase. There is strong resistance at $4,060. However, from the hourly chart, it can be seen that $4,088 is merely the 38.2% retracement level after the biggest decline since the historical high. Looking ahead, there are more significant 50% and 61.8% retracement resistance levels at $4,075.66 and $4,192.42 respectively. I still believe that the resistance at the previous double top neckline, $4,186, remains strong. In the short term, as expected, gold reversed upward on Monday this week and has since shown a balanced upward channel pattern. Measured by Fibonacci extension levels, the high of $4,046.21 reached this morning is about $13 away from the 100% extension level of $4,059.04, which is just below the Gann angle at $4,060. In other words, gold is now approaching a phase top and could fall sharply again at any time. The intraday decline target is $3,970. In the short term, gold prices remain in an upward trend that began after breaking through in the early morning of New York yesterday. However, it should be noted that if the gold price closes below $4,016.33 on the hourly chart, it would be a signal of a downturn. Aggressive traders may consider a break below the important Gann angle at $4,010 or even a fall below $4,000 (the 20-hour SMA is currently around $3,999.6) as a sign of a downturn. As of this morning, more than an hour after the opening of the Tokyo market, the gold price has not yet broken through the early Asian market high of $4,046.21. On the 5-minute chart, it shows a narrowing triangle, and the gold price has twice fallen to the $4,019 level. The possibility of a downward break seems greater, and it may target the 38.2% and 50% retracement of the largest increase since yesterday's low of $3,919.54, which means the short-term downward targets for the gold price are $3,987.29 and $3,970.36 respectively. The above content is for reference only and does not constitute investment advice. MTF Special Analyst Zheng Guangfu
2025-10-31
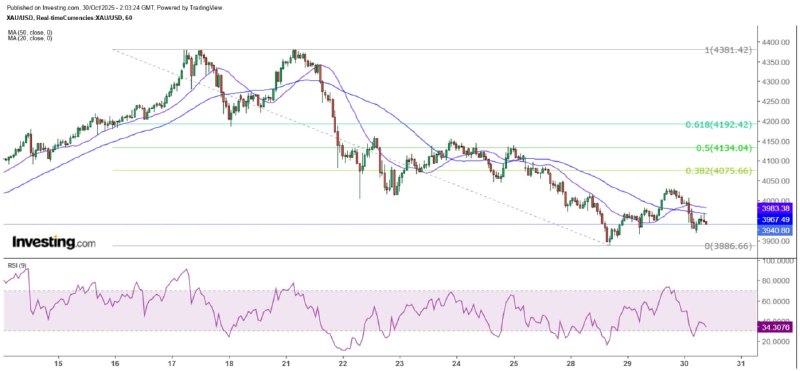
Gold prices will find support only when they fall to $3,810. 10:01 30/10/2025 Finalized I found that the gold price movement was one trading day ahead of my analysis. The gold price hit a low of $3,886.66 on Tuesday, which was about $40 higher than the central axis of the largest increase since August 20th, $3,846.44, as I pointed out on Monday. However, the gold price dropped continuously from the highest point of $4,019.4 to that level on Tuesday, falling by nearly $173. Therefore, it is understandable that the gold price has launched a strong rebound wave. The Federal Reserve's interest rate decision shows a three-way split. Before the Federal Reserve announced its interest rate decision yesterday, the gold price rose to a high of $4,029.74 and then fluctuated and fell below $4,000. After the Fed announced a 25 basis point rate cut, the gold price dropped to $3,979.43 and then rose to $4,007. It then fluctuated and fell. After the Asian market opened this morning, it rebounded from a low of $3,917.57. After the Tokyo market opened, it rose to a high of $3,966.52 but failed to rise further. It is currently supported at around $3,940. The Federal Reserve's interest rate decision was passed by a 10-2 vote at this meeting, but there was a three-way split. The new board member, Milan, continued to recommend a 50 basis point cut, while the Kansas City Fed's president, Schmidt, suggested keeping the rate unchanged. More committee members favored pausing rate cuts for at least "one cycle" (presumably meaning one meeting) to observe the cumulative effect of the rate cuts before making a decision. Regarding the U.S. economic performance, Powell indicated that economic growth was stronger than expected, but the job market was cooling. As for whether there would be a rate cut in December, he stated that it would depend on the economic data performance. At the same time, he pointed out that if the uncertainty remained extremely high at that time, the authorities would act cautiously. The current market is poised to break through 3910 on the downside. As the interest rate cut was expected and the possibility of a rate cut in December remains uncertain, the spot gold price, which was close to $4,000, came under pressure. In the early Asian session today, the price fluctuated, but generally remained within the Gann angle range of $3,910 to $3,960. From the hourly chart, it can be seen that the rebound high of the gold price yesterday was exactly the strong support level of $4,000 after the sharp drop on October 22. Therefore, when the price rebounded above this level yesterday, it encountered strong resistance. This morning, it fluctuated within a narrow range. The 5-minute chart shows a rare dense area, indicating that the gold price is likely to break below $3,910 again soon. It is expected to find support at the Gann level angle of $3,810, and $3,960 has become the main resistance for the day. The above content is for reference only and does not constitute investment advice. MTF Special Analyst Zheng Guangfu
2025-10-29
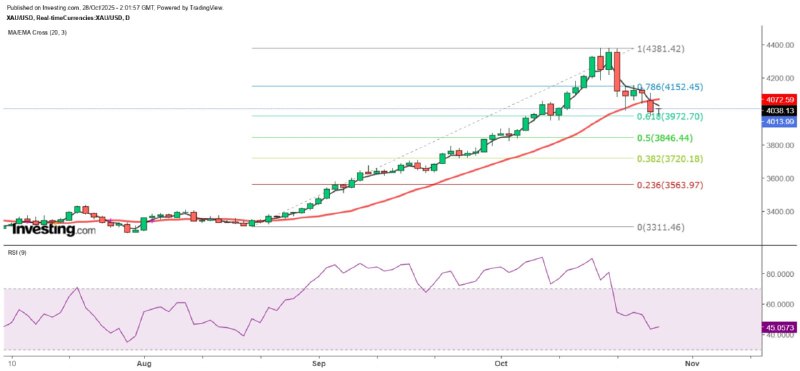
"Gold Price Must Rise Above 4210 to Be Optimistic" 28/10/2025 9:57 Completed Gold prices finally broke through the $4,000 mark. Before the close of the London market yesterday, they dropped to a low of $3,971.92 an hour before the close. They then rebounded to a high of $4,010.24, which was exactly at the 90-degree vertical angle of Gann, and thus were clearly blocked and fell back. This morning in the Asian market, they dropped to a low of $3,973.9 before climbing again. The current high is $4,019.71, slightly breaking through the 20SMA (4,019.2) on the hourly chart. However, there is significant selling pressure near this line, and after a period of sideways movement at the high, they resumed their downward trend. Short-term rebounds face numerous obstacles. Last Friday, I expected that Monday would be the reversal day for gold prices. I originally anticipated that it would remain above the $4,000 mark with a slightly weak trend and then rise due to expectations of the Federal Reserve cutting interest rates. However, gold prices broke through the $4,000 mark yesterday. As this was the level that gold prices had held firm at during multiple adjustments after reaching a new high, yesterday's breach indicates that a new trend has begun. This morning's attempt to challenge the 20SMA on the hourly chart was unsuccessful, reflecting that the weakness in gold prices remains. Even if gold prices break above this line, they will face greater resistance, first at the 20-day SMA ($4,072), then at the 135-degree angle of Gann's grid at $4,110, and the neckline of the double top on the hourly chart at $4,186. Only by breaking through the 180-degree angle of Gann's grid at $4,210 and holding above this level can there be hope for further gains in the future. Whether it can reach a new high is another matter. A break below the 20-hour SMA could see 4055. In the short term, the gold price seems to have formed a small double bottom on the hourly chart. If the neckline is set at $4,010.24, the measured upside target would be $4,048.76, which is close to the 50% retracement level of the biggest decline since last night's sharp drop at $4,055.12. Therefore, the first major resistance for the short-term rebound would be this level, provided that the gold price breaks above the 20-hour SMA. It should be noted that if the gold price has already turned downward, a 25 basis point interest rate cut by the Federal Reserve will not generate a new round of upward momentum for the gold price. Instead, it is highly likely that the gold price will fall below $4,000 again due to the Fed's concerns over rising inflation and make a deeper adjustment. The initial target is the mid-point of the biggest increase since August 20 at $3,846.44. The above content is for reference only and does not constitute investment advice. MTF Special Analyst Zheng Guangfu
2025-10-28
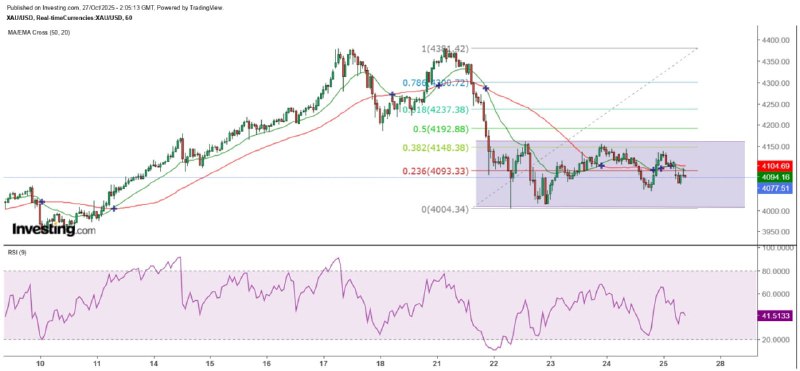
"Last Bounce Before Gold Price Breaks Through 4000" 27/10/2025 9:57 Completed Last week, the US released its September CPI, which rose by 3% year-on-year, slightly lower than the expected 3.1%, but still 0.1 percentage point higher than that of August. It was the first time since January this year that it exceeded 3%. Whether this indicates a warning sign of rising inflation remains to be seen. However, the data is believed to make the Federal Reserve more cautious in its judgment of the inflation outlook. Even if it still leans towards a 25 basis point rate cut after this week's interest rate meeting, it is believed to remain highly vigilant about inflation. It is just that the impact of tariffs on inflation has not been obvious yet, so the Federal Reserve has shifted its focus to the weak job market. After the release of the US September CPI data, the gold price immediately rose by more than 30 dollars from a low to 4092.81 dollars, then fluctuated and rose to approach 4134.92 dollars but was blocked and gradually pulled back. After the London market closed, it slightly rose to 4138.52 dollars but was blocked again. Subsequently, it formed a double top pattern and finally closed above 4110 dollars. However, during the holiday, it was reported that the US and China had reached a preliminary framework agreement on trade. The gold price opened nearly 40 dollars lower in today's Asian market, falling to a minimum of 4058.61 dollars. It then continued to rebound but was still constrained by 4100 dollars. Beware of gold price decline after interest rate decision From the hourly chart, the gold price has returned to the sideways range since last Thursday and is fluctuating within the Gann angle between $4,060 and $4,110. Last week, it was pointed out that today is the reversal day for the gold price. This morning, the gold price continued the downward trend from last week. If it closes with a bearish candlestick, the meaning of the "reversal day" will be clearly indicated, and the gold price is likely to start a sustained rise from tomorrow. The reason is that the market expects the Federal Reserve to cut interest rates after the interest rate decision on Thursday morning. However, the rate cut is already within market expectations, so the gold price may fall again after the announcement of the interest rate decision. Since the gold price plunged sharply on October 21 and broke through the neckline of the double top on the hourly chart, the highest rebound so far has only reached $4,161.39, still $25 short of the neckline at $4,186.4. Even if the gold price touches or breaks through this level this week, given the current trend, it is unlikely to break through. This week, the gold price is likely to fall below the last rebound before it dropped below $4,000. From the trend analysis, after the sharp drop, the gold price has been moving sideways, which is a typical consolidation and break pattern (the sideways consolidation after a sharp drop indicates a higher probability of a downward break). The 20-day moving average of gold prices must not be lost. As seen from the daily chart, after gold prices broke through the 20-day SMA (currently around 3772) last Wednesday, although they eventually closed above this line, there has been no significant rebound to break free from its pull. Last Friday, prices even briefly fell below this line. Therefore, it is important to pay close attention. If gold prices close below the 20-day SMA, there is a high possibility of further decline, and conservatively, it could fall to 3510 US dollars. For today, 4060 US dollars is a key support level. If this level is breached, gold prices will test 4010 US dollars. Conversely, if they break above 4110 US dollars, the likelihood of challenging 4186 US dollars increases. The above content is for reference only and does not constitute investment advice. MTF Special Analyst Zheng Guangfu
2025-10-27
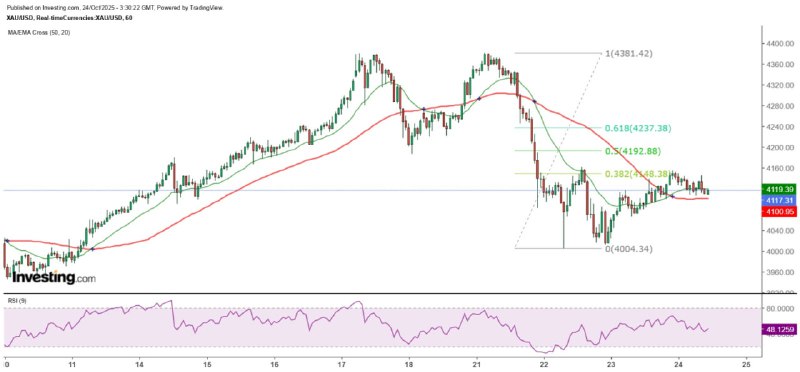
"Gold Price at $4,110 as Key Support" 24/10/2025 11:28 Finalized Gold prices rose above $4,110 as expected, but yesterday's gold prices showed no clear direction. Most of the short-term trends that should have occurred in the past did not materialize. Perhaps this is because the US will release the CPI for September tonight. The expected inflation rate is expected to expand from 2.9% in August to 3.1%. Although the Federal Reserve is almost certain to cut interest rates by 25 basis points next week, if the inflation rate returns above 3%, the dovish voices within the Federal Reserve are expected to be somewhat restrained. Short-term resistance at $4,160 Yesterday, the gold price fluctuation narrowed slightly to around $89.5, with the high at $4,154.96 and the low at $4,065.49. In other words, the gold price fluctuated within the two Gann angles of $4,060 to $4,160 yesterday. However, it should be noted that neither of them is a significant or secondary support or resistance level. Therefore, the gold price is likely to break through either side in the short term. Looking upward, the $4,186 is the neckline of the previous double top on the hourly chart, and yesterday's high was about $31 away from it. Further upward, there is a strong resistance at $4,210. Thus, it is normal for the gold price to pull back slightly after breaking through $4,160. Looking at the hourly chart, the rebound from $4,004.34 is the largest since Monday, with a decline of more than 40%. The gold price has twice been blocked at around $4,155. Conversely, if it breaks through this level, the possibility of challenging $4,210 is very high. In fact, during the Tokyo midday session today, the gold price fell below $4,110, but the lowest point was $4,105.74, where there was a struggle. After that, the gold price broke through and rose sharply, reaching a high of nearly $4,120 before falling sharply again. It is currently supported at around $4,111. Next Monday will be the reversal day for gold prices. From the perspective of short-term cyclical trends, next Monday is the reversal day for gold prices. Assuming that the price moves upward, if the rebound reaches 50% of the largest decline since the historical high, it could rise to $4,192.88, which also meets the conditions for the end of the c-wave rebound. At that time, the gold price will fall sharply again. Currently, $4,110 is a key support level. Once it is breached, $4,000 will come under pressure again. The gold price has been trading above this level for more than two days. The longer the sideways movement lasts, the greater the selling pressure when it breaks through $4,000. A short-term fall to $3,500 is not out of the question. The above content is for reference only and does not constitute investment advice. MTF Special Analyst Zheng Guangfu
2025-10-24
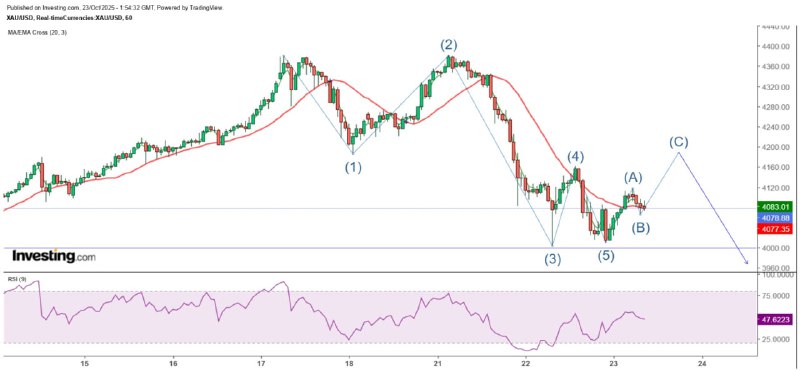
"Gold Price Expected to Rebound to $4,110 in the Short Term" 23/10/2025 10:00 Completed Yesterday, the spot gold price attempted to break through the $4,000 mark several times but was met with strong support. The lowest it reached was $4,004.34 in the early Asian session. Later, it rose to $4,161.39 in the early European session before falling again. In the mid-European session and an hour before the London close, the gold price dropped to $4,015 and $4,011 respectively, but rebounded significantly. It then rose above the $4,100 mark in the mid-New York session and gradually pulled back. After falling below $4,089, it rebounded again. In the early Asian session today, it reached a high of $4,116.35, but clearly encountered resistance at the 45-degree angle of Gann's grid at $4,110. The sudden penetration of 4080 material is a false breakthrough. Overall, gold prices found initial support at around $4,000. Yesterday marked the first time since August 20th when gold prices broke above the 20-day SMA (currently around $4,036) that they tested below this line. Fortunately, they closed above it. This suggests that after several major adjustments recently, the downward trend may have temporarily halted, and the short-term outlook leans towards a rebound. Notably, this morning, after a sharp drop below $4,080, gold prices did not continue to decline as they had in the past few days. Instead, they bottomed out at $4,066.55 and gradually climbed back to recover all lost ground. This was clearly a false break. Although they later encountered resistance at the 20SMA on the 5-minute chart and fell again, they bottomed out at around $4,072 and rebounded. They then broke above the 20SMA (currently around $4,082) with a strong bullish candle and entered a consolidation phase. Subsequently, they repeatedly tested $4,070 and found support. Be cautious of a sharp drop after breaking through 4186. I estimate that the probability of gold price rising repeatedly within the day is relatively high. Although 4000 or 4010 US dollars has become a strong support level, the next level of support is 4066 US dollars. Since 4100 US dollars has been broken through, the resistance at this level has weakened significantly. However, 4110 US dollars is a Gann angle with relatively minor support or resistance, and the possibility of the gold price breaking through this level is high. If so, the gold price will target 4160 US dollars at the 180-degree angle. Judging from the hourly chart trend, the gold price is likely to be in the b-wave correction wave, and then a c-wave rise will occur, breaking through the double top neckline at 4186 US dollars. However, it is likely to then enter a higher-level 3-wave, indicating that the gold price will fall below the 4000 US dollar mark. Assuming that 4187 US dollars is the top of the c-wave and using the same calculation that the 3-wave is 1.618 times the 1-wave, the gold price will fall to 3576.88 US dollars. Currently, the 9RSI on the monthly chart of the gold price is still as high as 95, and it is too early to say that the bottom has been reached. The above content is for reference only and does not constitute investment advice. MTF Special Analyst Zheng Guangfu
2025-10-23
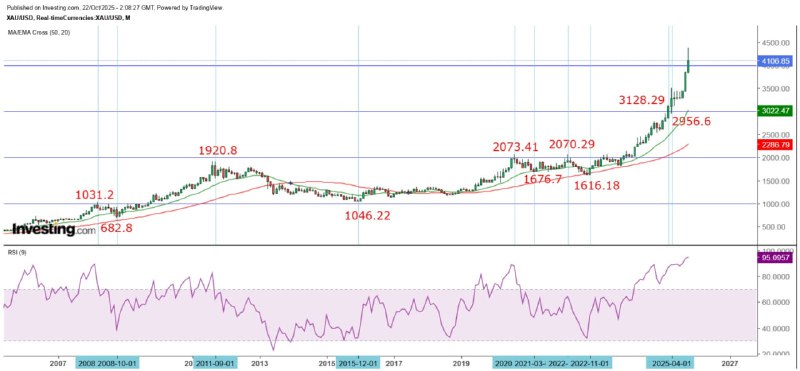
"Gold Price at $4,000 Will Surely Fall" 22/10/2025 10:10 Completed The major adjustment of gold prices kicked off this week. Although the low point reached in the early Asian session today was $4,004.34, which is close to the double top measurement decline target of $3,991.38 I pointed out yesterday, when all investors saw that the gold price dropped by more than $200 in a single day yesterday, even those who were pretending not to notice couldn't help but take action. This morning, the gold price rebounded to a high of $4,120.38 before falling again. At the time of writing, it was still holding above $4,100. The sharp drop in the gold price has caused the 9RSI on the daily chart to fall to 52, but it is still above 95 on the monthly chart. This shows that the adjustment in the gold price is far from over. Technically speaking, the gold price could fall close to the measured decline target of the double top on the hourly chart and then rebound sharply. Logically, this wave should be able to challenge the neckline at $4,186, and only if it fails to break through will it fall back again. However, in the past long period, a large amount of funds have flooded into the gold market. The sharp decline this week is likely caused by a large amount of funds flowing out of the gold market. Does this still need to prove that the gold price is weakening? Therefore, I think that if the major players are determined to test the resistance level, they should directly challenge the 4400 mark. But then again, why didn't the gold price break through this level when it approached 4400 dollars from last Friday to the beginning of this week? Has this round of adjustment already digested the accumulated selling pressure over the past long period? Gold prices are expected to fall to 3,505 before stabilizing. The question to consider now is whether, after the gold price breaks through a positive thousand-digit mark, it can always hold that level without breaking it and move on to the next thousand-digit mark. The trend since 2008 shows that the answer is no, although the extent of the adjustment varies. Only in March this year, after breaking through the $3,000 mark, did the price only fall back to $2,956.6 in April before climbing again. In other words, it is a hundred percent certain that the gold price will fall below $4,000 in November! As for the extent of the adjustment, excluding the two extreme cases, namely the decline in 2008 and the period from 2011 to 2015, as well as the drops in April and May this year, the adjustment is generally around 20% (the market generally considers a 20% drop from the peak as a bear market). Therefore, if the current historical high of $4,381.42 is adjusted by 20%, the gold price will fall by $876.28 to $3,505 before it is expected to stabilize. $4,186 is the maximum rebound target. In the short term, gold prices rebounded to $4,120 this morning but were blocked and fell back. The $4,110 level is at the 135-degree angle of Gann's theory, which is considered a relatively weak resistance point. Therefore, be cautious that gold prices may further challenge the $4,210 level at the 180-degree angle before making a significant adjustment again. However, if $4,110 does prove to be a resistance, gold prices will again test the $4,010 level at the 90-degree vertical angle. A break below this will see a test of the $3,910 level at the 45-degree angle, and another break will see a test of the $3,810 level at the horizontal line. The $3,505 level mentioned earlier, which represents a 20% decline, is close to the $3,510 level at the 135-degree angle. The maximum acceptable rebound target for now remains the double top neckline at $4,186 on the hourly chart. The above content is for reference only and does not constitute investment advice. MTF Special Analyst Zheng Guangfu
2025-10-22
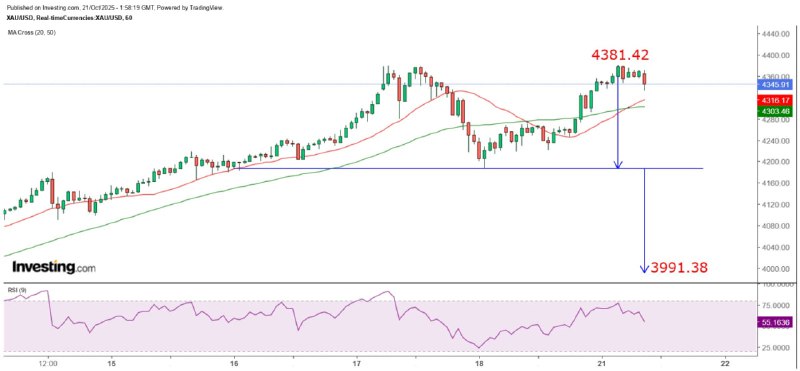
"Gold Price Hourly Chart Shows a Large Double Top" 21/10/2025 9:58 Completed Yesterday, the gold price continued the upward trend from last Friday. It twice tested the support at $4,220 and then climbed further, eventually breaking through the top of the horizontal range at $4,270. It then broke through the resistance of the 225-degree angle of the Gann Square at $4,310. After a correction, it rose to $4,355 and then entered a sideways pattern. However, in the New York afternoon session, it rose further, reaching a new historical high of $4,381.42. It then dropped sharply and stabilized at $4,346 before rebounding again, but only reached $4,375 before entering a sideways pattern once more. The $4,000 mark faces strong resistance. Gold prices remained above $4,360 in the early Asian session today, fluctuating. From the hourly chart, it is clearly seen that a large double top has formed around $4,380. It is expected that another major adjustment will soon take place. Currently, it remains to be seen whether gold prices will move towards the strong resistance at the 90-degree angle of Gann at $4,410 before correcting. If so, the increase in gold prices will exceed $50. However, considering the recent volatility, gold prices still have the potential to rise by another $30 or $50. However, this will inevitably consume the strength of the bulls, so a sideways consolidation is necessary before a new offensive can be launched. Indians switch to buying silver for Diwali. I believe that the sharp drop in gold prices last Friday has reflected that the price of $4,000 is considered an unacceptably high level. Reports suggest that India, which traditionally buys gold during Diwali, has switched to buying silver, and gold is even out of stock (not due to high demand but because there is no gold available for sale). This could be an excuse for another major adjustment in gold prices. In fact, I think many investors will find that they no longer have much feeling about the continuous new highs of gold prices and are not as reluctant as before to buy at high prices. This is exactly what I mean: when the big players are ready to sell, there are small investors willing to take over the goods, and the big players can cash out at high prices without the prices being depressed by their large sell orders! When the 9RSI of the monthly line exceeds 90, a significant decline is inevitable. From the monthly chart, the 9RSI of gold price has further risen to nearly 96. I still stress that this is a signal of an impending crash. In June 1973, the 9RSI of gold price on the monthly chart reached 96.5, and the gold price peaked at $123.55. However, it dropped to $98.3 in October of the same year, a decline of 20.4%. In January 1980, the 9RSI of gold price on the monthly chart reached 93.5. The gold price peaked at $627 in February, fell to $535 in May, then rose again, and peaked at $629 in October. After that, it dropped sharply, reaching a low of $342.9 in July 1982, with a maximum decline of nearly 45.5%. This reflects that when the monthly RSI of gold price exceeds 90, the ultimate outcome is a sharp decline. Of course, you may continue to buy gold, but when the reversal signal has emerged, you should think twice before chasing the high gold price. Note that the reversal signal that appeared on the daily chart of gold price last Friday is still valid. Unless the gold price closes above the high of last Friday, the risk of a sharp decline in gold price remains extremely high! There is a chance for gold price to test the neckline of the double top at $4,186 within the day. Once it breaks through, the measured decline target is $3,991.38. The above content is for reference only and does not constitute investment advice. MTF Special Analyst Zheng Guangfu


