
 en-US
en-US 

 Telegram
 WeChat

2026-08-20
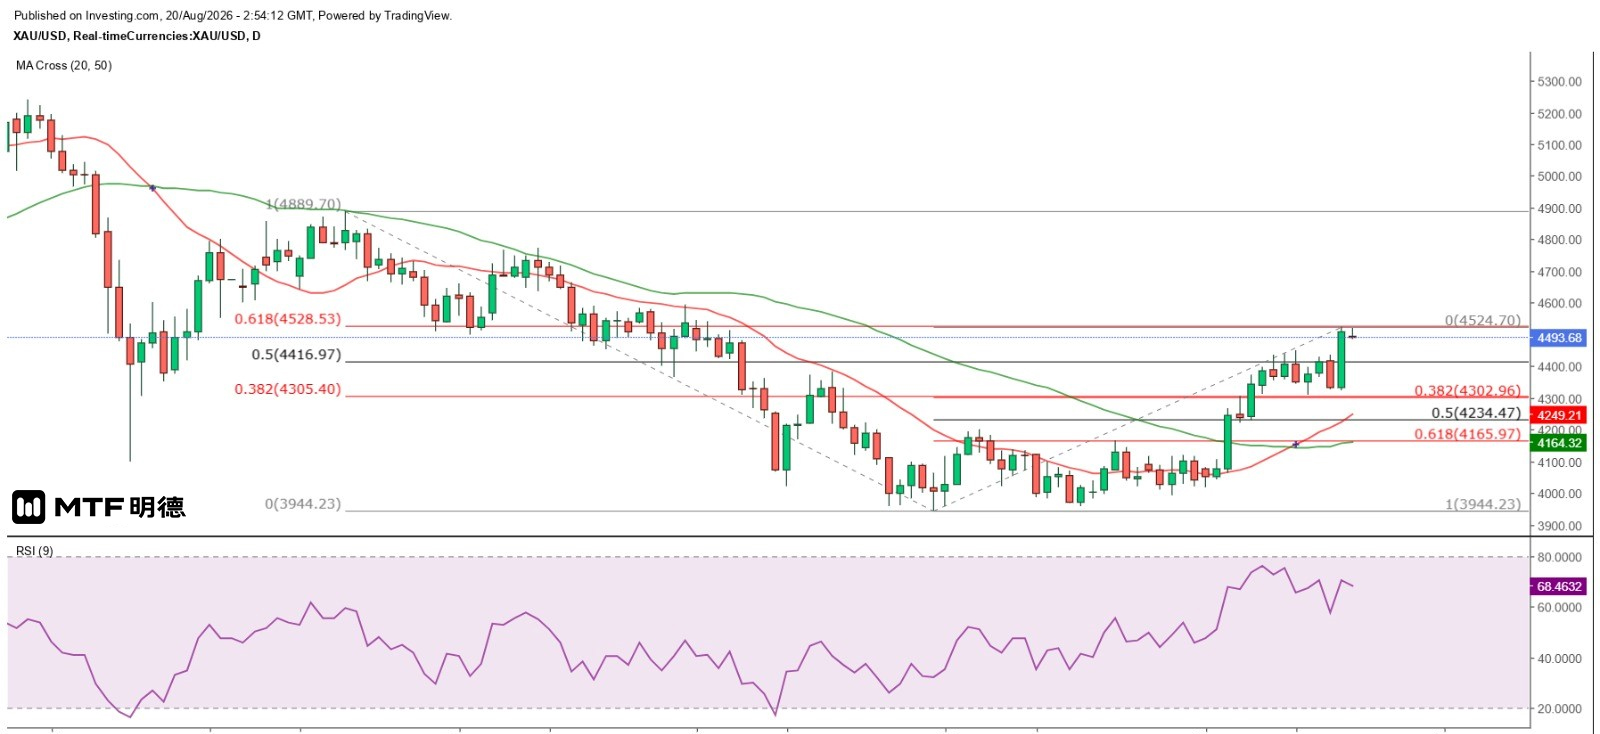
"Gold Price at $4,510 Likely to Act as Intraday Resistance" – Completed on 8/20/2026 at 10:52 Yesterday, gold prices surged sharply, with spot gold reaching a high of $4,524.32. This morning, after opening in Asia, the price hit a peak of $4,527.67 within the first five minutes but then declined steadily, falling as low as $4,484.67 before rebounding. However, it failed to regain the $4,500 level. Yesterday’s daily range exceeded $200—the second time since August 5—and formed a bullish candlestick pattern similar to that seen on August 5. Could this signal a repeat of the subsequent trend—further gains followed by consolidation at higher levels? The sharp rise in gold was primarily driven by the U.S. Treasury's announcement that it would increase its bond buyback program for 10- to 30-year maturities from the current $2 billion to a minimum of $4 billion, aimed at supporting market liquidity and easing pressure caused by rising bond yields. The Treasury’s move effectively increases the supply of dollars while reducing the supply of U.S. Treasuries, thereby putting downward pressure on both the dollar and bond yields. Indeed, net inflows into U.S. equities have surged dramatically this year—from $92 billion in January to between $535 billion and $594 billion in July—significantly tightening dollar liquidity. As a result, gold prices were naturally stimulated to climb rapidly. On the daily chart, yesterday’s rally brought gold close to the 61.8% retracement level of the largest decline since April 17, at $4,528.53. Additionally, the $4,510 level lies along Gann’s square at the 315-degree angle, marking a weak resistance (or support) zone, increasing the likelihood of short-term consolidation. For now, the initial correction target is around $4,450, with $4,410 shifting from strong resistance to strong support, and $4,300 forming the next stronger support level. Following a significant advance, gold typically experiences a meaningful pullback, and today’s rebound is expected to be capped by the $4,510 level. The above information is for reference only and does not constitute investment advice.
2026-08-19
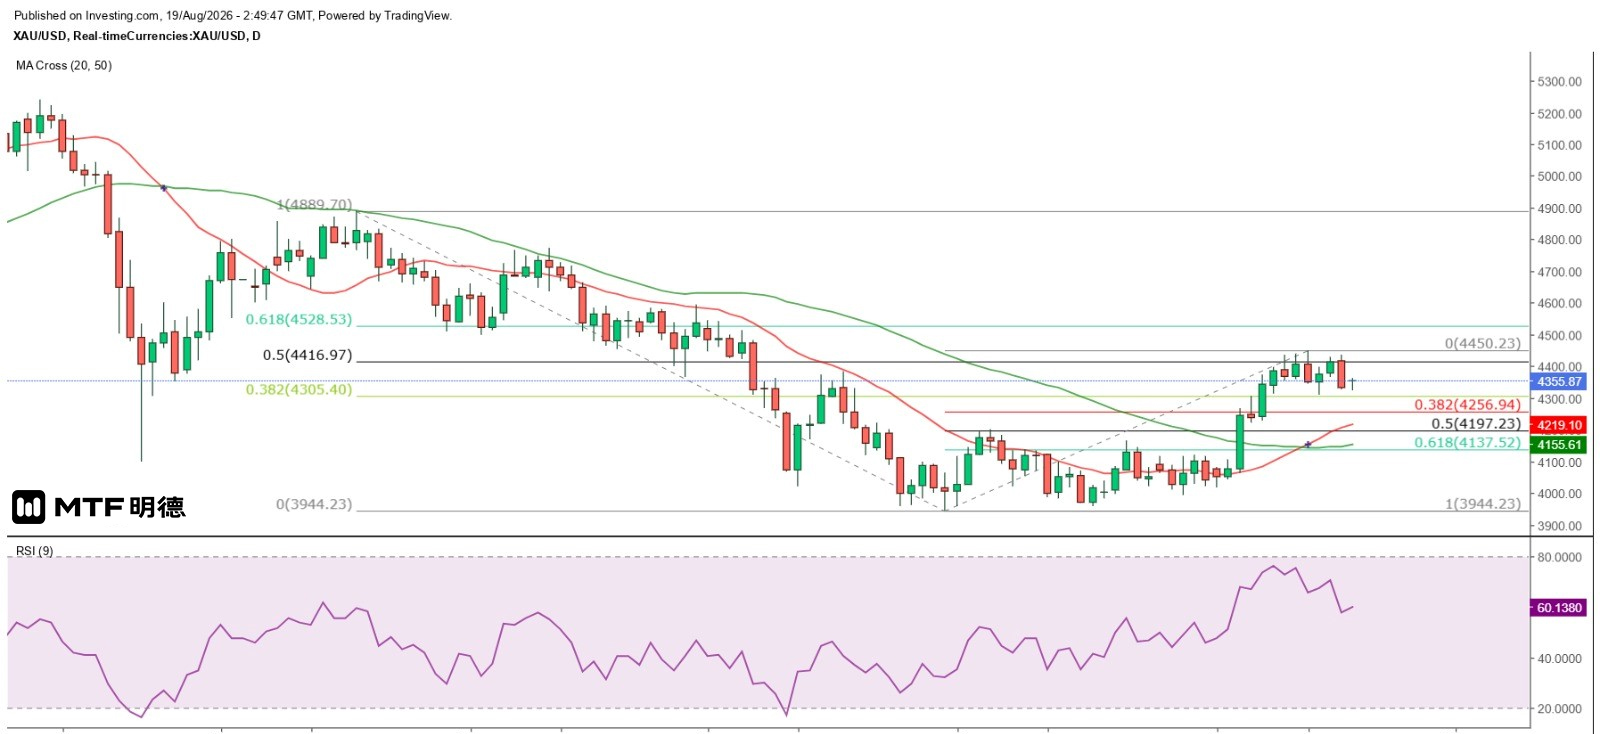
Gold Price May Bottom Out and Rebound This Friday August 19, 2026, 10:48 AM The gold price continues to adjust. Yesterday's volatility exceeded $103, yet it still closed down by over $83, marking the second time since August 13 that a "head-and-shoulders" pattern has formed on the daily chart—indicating strong selling pressure remains. On the daily chart, the 20-period SMA (4219) has further diverged upward from the 50-period SMA (4155), suggesting that the support level for any pullback is steadily rising. Based on gains since June 30, gold may stabilize at either the 38.2% retracement level (4256.62) or at the Gann Square 180-degree angle of $4,210 before launching a new upward wave. In the short term, after touching a low of $4,324.3 in this morning’s Asian session, gold formed a bullish engulfing candlestick on the hourly chart, indicating some support around the Gann Square 225-degree angle at $4,310. Currently, prices have rebounded to near $4,360—the midpoint between the weak support at $4,310 and the strong resistance at $4,410. Whether gold can climb further depends on whether it breaks above the hourly 20-SMA at $4,368. Even then, a close above yesterday’s high of $4,436.39 would be required to signal a reversal of the downtrend. On the hourly chart, gold remains range-bound with slightly narrowing volatility. The sharp rebound this morning from $4,324.3 was technically driven by the 9-RSI dropping as low as 12, signaling extreme oversold conditions; currently, the 9-RSI has risen to 47. Judging by short-term cyclical patterns, gold is likely to continue fluctuating downward before bottoming out this Friday, followed by a strong recovery. If the lows reach the daily 20-SMA or $4,210 at that point, the likelihood of an upward rally increases significantly. The above information is for reference only and does not constitute investment advice.
2026-08-18
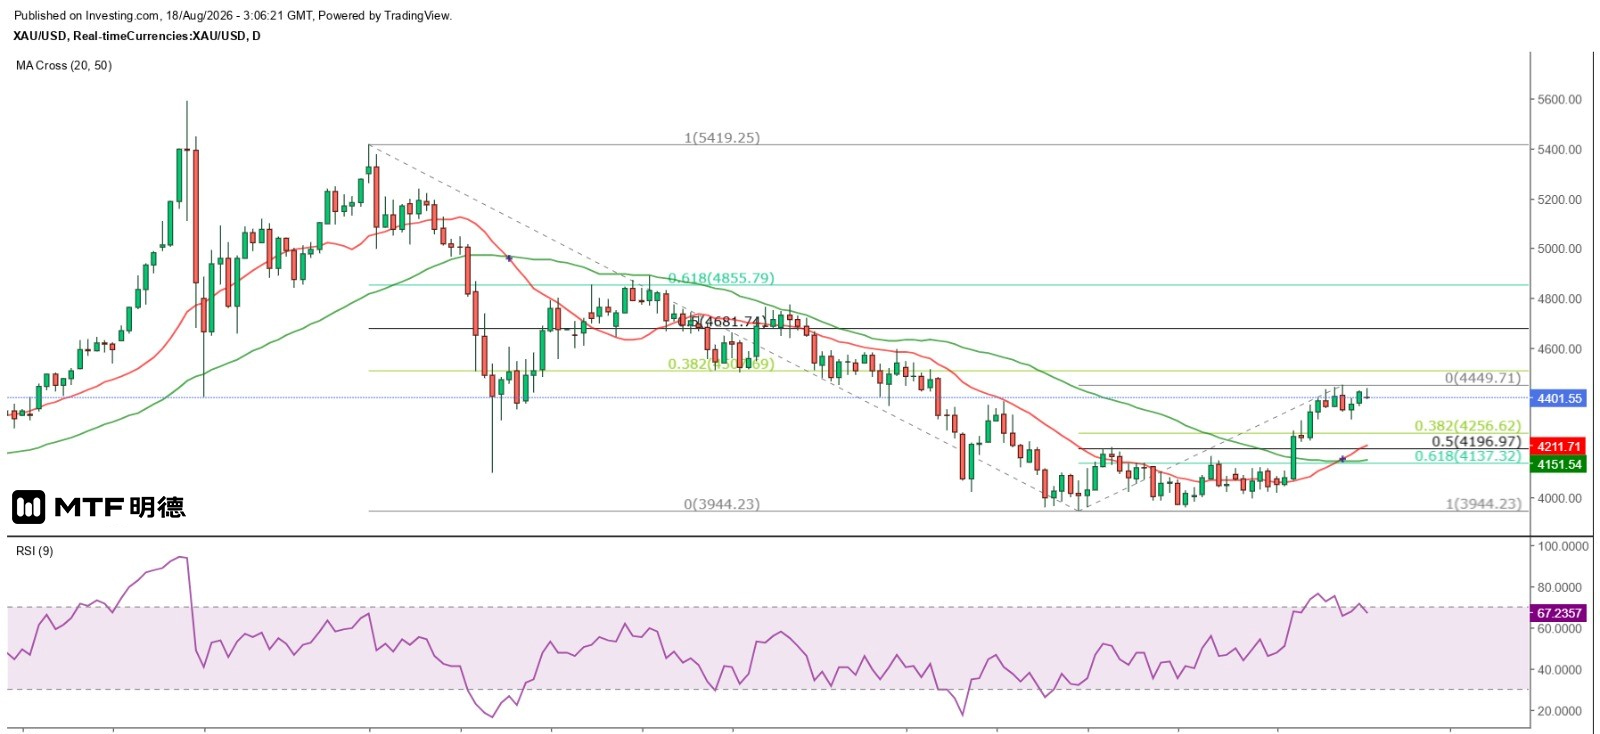
"Gold Price Retracement: Still Primarily Buy on Dips" – Completed on 18/8/2026 at 11:03 In the blink of an eye, the 60-day temporary ceasefire and negotiation deadline between the U.S. and Iran expired yesterday. Not only has no nuclear deal been reached, but passage through the Strait of Hormuz remains partially restricted. U.S. President Trump is expected to abandon further negotiations with Iran, and foreign media report that the U.S. will reimpose oil sanctions and maritime blockades against Iran. Last week, U.S. Treasury Secretary Yellen stated that unprecedented financial sanctions against Iran are imminent. Yesterday, Brent crude futures rose back above $90 per barrel, while New York's front-month crude held steady around $84. Spot gold prices fluctuated upward yesterday, reaching a high of $4,436.15 in early Asian trading this morning before retreating. On the hourly chart, a strong bearish "head-and-shoulders" reversal pattern emerged. Although gold did not follow the balanced downward channel as previously indicated, it now appears more likely to have formed a double-top pattern on the hourly chart—suggesting a short-term trend toward continued correction. The neckline is seen at $4,311.22, with a simple measured target for the decline at $4,186.29. From a Gann square perspective, if gold confirms a break below $4,410 (a vertical angle at 270 degrees), it could test the double-top measured target of $4,186.29, meaning the 180-degree angle level at $4,210 would come under pressure. Even if we interpret the current movement as sideways rather than a double top on the hourly chart, a breakout above $4,449.71 would be required to break the stalemate. However, the daily chart outlook is less pessimistic. Recent price declines merely reflect a pullback after reaching the 50% retracement level from the largest drop since April 17, initiating a corrective wave. Moreover, gold has significantly pulled away from both the 20-day and 50-day moving averages, creating ample room for a pullback. Therefore, investors may consider establishing long positions during this short-term correction. Taking June 30’s low as the start of the recent rally, potential entry points could include the 38.2%, 50%, and 61.8% Fibonacci retracement levels at $4,256.62, $4,196.97, and $4,137.32 respectively. In summary, until gold clearly breaks below the 50-day SMA on the daily chart, waiting for lower levels to buy remains the primary strategy. The above content is for reference only and does not constitute investment advice.
2026-08-17
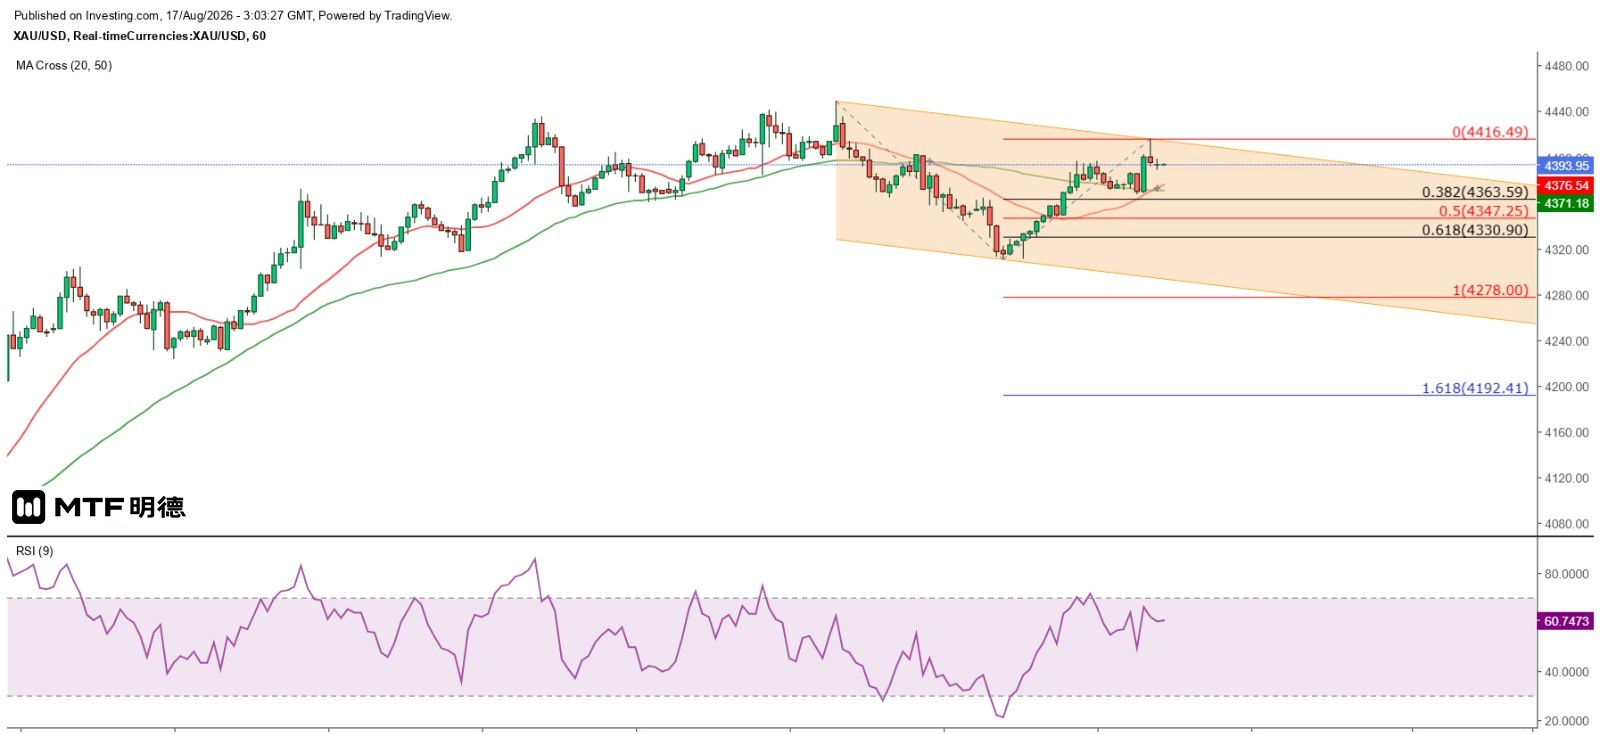
Gold Price Poised for a New Uptrend Completed on 17/8/2026 at 11:00 U.S. retail sales unexpectedly declined in July, falling by 0.6% month-on-month—below the expected gain of 0.1% and June’s 0.2% increase—and marking the first drop since October 2025. Core retail sales also fell by 0.3% month-on-month, underperforming both the forecasted 0.2% rise and June’s 0.2% decline. Year-on-year growth slowed from 6.75% to 5.01%. The main driver behind the July decline was a 2.2% monthly drop in non-store sales, likely reflecting Amazon's shift of its member-exclusive discount day from July to June. Therefore, the unexpected fall in U.S. retail sales does not necessarily indicate a weakening market. Speculators seized the opportunity, capitalizing on expectations of lower interest rates. Gold prices surged immediately after the retail data release, climbing to $4,386.91, then retraced to a low of $4,370.09 within the following half-hour before recovering sharply to reach a high of $4,396.88. Subsequently, prices pulled back again. At London’s close, gold peaked at $4,396.67 before forming a double top on the five-minute chart and declining. This morning, spot gold briefly hit $4,416.49 but later retreated below $4,400, indicating that the 50% retracement level of the largest decline since April 17—$4,416.97—remains a key resistance. However, on the hourly chart, gold broke above the 50-period SMA (currently around $4,371.6) early Friday in New York trading and has clearly held above this line since. This morning, after briefly testing the 50SMA, it closed with a strong bullish candlestick, surpassing last Friday’s high. Meanwhile, the 20SMA is now beginning to cross above the 50SMA, suggesting that after consolidation, gold may retest the $4,416 resistance level today. Notably, if gold holds firmly above the Gann 270-degree vertical angle at $4,410, it would signal readiness for a new upward move, targeting $4,510 and $4,660. Thus, the 50SMA on the hourly chart and today’s bullish candle’s low at $4,368.32 should be viewed as critical support levels, implying a strong rebound if prices fall to those levels. From a more conservative perspective, gold could potentially form a balanced descending channel on the hourly chart. If so, the key support would be the Fibonacci 100% extension target from August 13 at $4,278. However, any short position would require confirmation that gold closes significantly below $4,368.32 on the hourly chart without generating strong reversal signals such as a double K-line pattern. The above information is for reference only and does not constitute investment advice.
2026-08-14
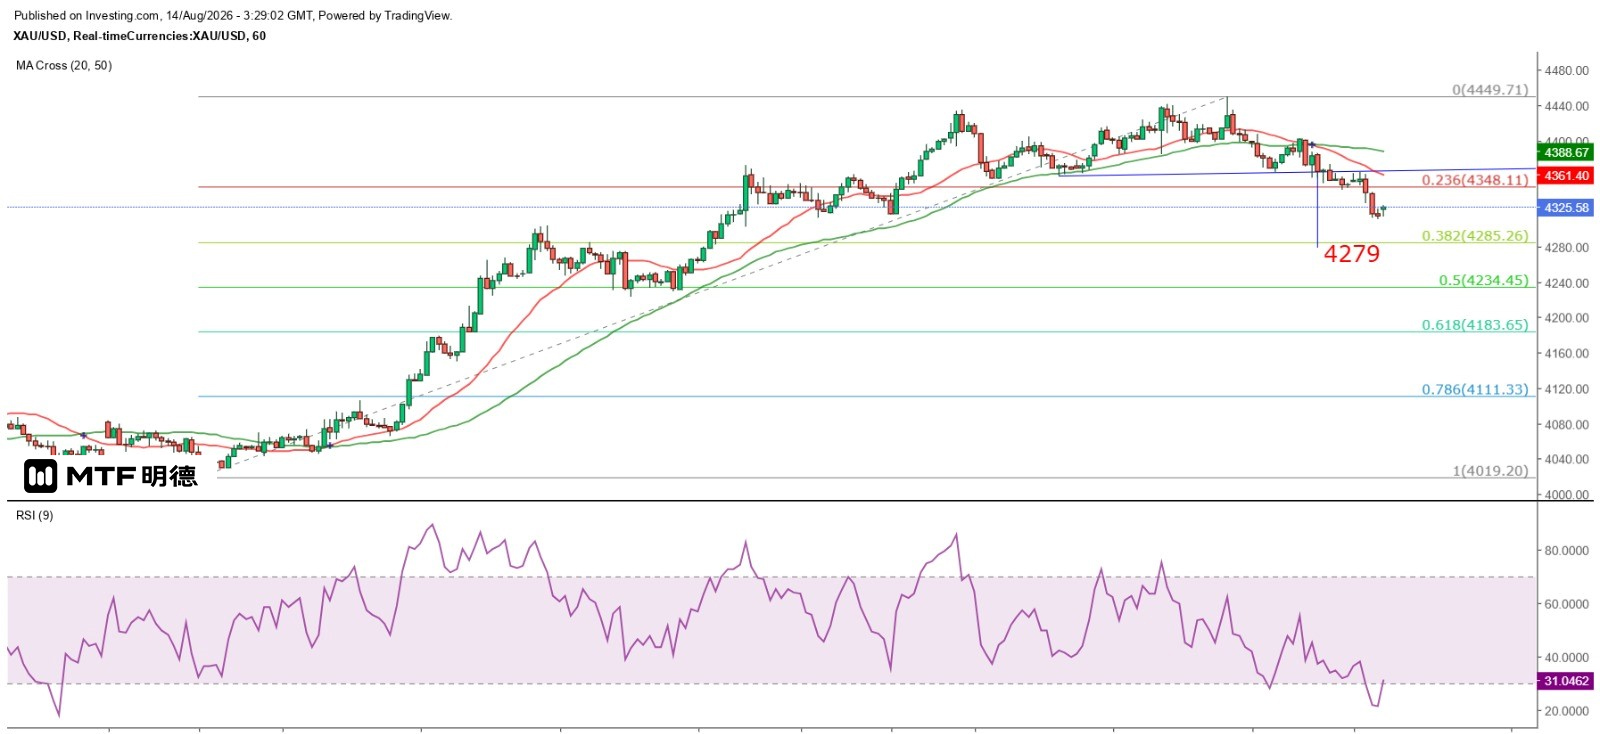
"Gold Price in Technical Correction" – Completed on 14/8/2026 at 11:26 The U.S. July PPI rose 4.7% year-on-year, below the expected 4.9% and June's 5.5%. Core PPI increased 4.2% annually, matching expectations but still lower than June’s 4.7%. The data indicates that inflationary pressures driven by soaring oil prices are easing. Markets no longer expect the Federal Reserve to raise interest rates this year, yet gold prices fell instead of rising. One possible reason is profit-taking by investors; another is that although the annual PPI growth has moderated, it remains elevated—likely prompting the Fed to maintain current interest rates rather than cut them. Cleveland Fed President Harker reiterated the need for immediate rate hikes to bring inflation back to the 2% target. Richmond Fed President Barkin stated it was unclear whether further tightening would be needed to meet inflation goals. Meanwhile, Chicago Fed President Goolsbee expects inflation caused by tariffs and oil prices to be temporary, with a gradual return to stability. However, during the July monetary policy meeting, three members—including Harker—supported a rate hike, highlighting internal divisions within the Fed. Given the current Middle East tensions, slow inflation decline, and weakening labor market, it is likely that interest rates will remain unchanged in September. Although gold prices continue to fall, the decline appears to be a technical correction, as prices have retraced about 50% from their peak drop since April 17. On the daily chart, gold broke above the 50SMA (currently around 4146) on August 5, crossing the 20SMA (currently around 4172). After reaching a high of $4,450.23 yesterday, gold closed in a bearish engulfing pattern, indicating ongoing short-term selling pressure. A rebound may not occur until early next week. The 20SMA and 50SMA are seen as strong medium-term supports. For most of the day, prices are likely to remain constrained by the hourly 20SMA (currently around 4361), continuing to trend downward along this line. Additionally, tonight’s release of U.S. July retail sales data should be closely watched—if retail activity remains robust, renewed concerns over rate hikes could trigger a sharp drop in gold prices! The above information is for reference only and does not constitute investment advice.
2026-08-13
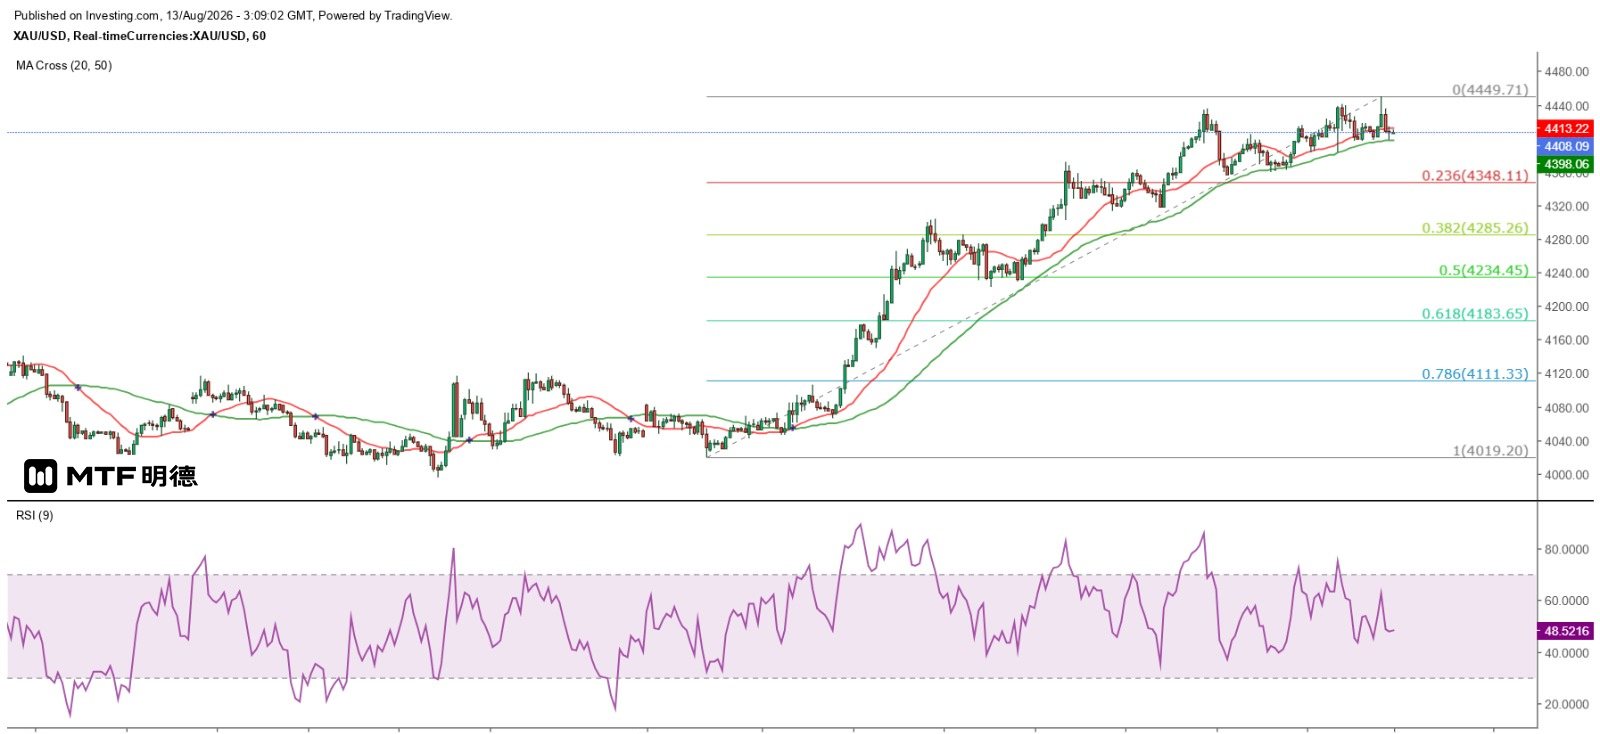
"Gold Price Awaits Breakout with Cautious Optimism" – Completed on 13/8/2026 at 11:06 Yesterday, the U.S. Department of Labor released July CPI data, showing an annual increase of 3.4%, down from June's 3.5%. The core CPI also slowed slightly to 2.5% year-on-year from 2.6%. However, these figures are insufficient to ease the Federal Reserve’s vigilance on inflation or prompt any rate cuts. Yet gold prices surged sharply. I find it highly勉强 to explain this move solely by CPI data; instead, oil-related developments appear to be the primary driver behind gold’s rapid rise. Yesterday, the U.S. Energy Information Administration (EIA) reported that crude oil inventories increased by 17.423 million barrels in the week ending August 7, reaching 424.4 million barrels—the highest level since 2023. Additionally, EIA’s monthly report released on the same day projected that natural gas production—accounting for 40% of the U.S.’s primary electricity generation—will hit a new record this year. Production in the first half of 2026 was already up 4% compared to the same period last year. The United States has been the world’s largest natural gas producer from 2009 through 2024. Based on this, investors likely believe that U.S. inflation will decline as a result, reducing the risk of sustained upward pressure and thereby lowering the likelihood of further Fed rate hikes. For gold, spot prices have clearly stabilized above $4,000. However, they remain near the 50% retracement level of the largest drop since April 17, meaning technical correction risks remain high. That said, if even such inflation data fails to push gold lower, investors should watch closely: once gold firmly reclaims above $4,410, there is a strong chance it could test the Gann 180-degree angle at $4,210, potentially triggering a larger corrective wave. On the other hand, the hourly chart of spot gold suggests significant downside potential. If prices close below the 50SMA ($4,398), they may test $4,285 or even $4,234—or possibly $4,183—before regaining momentum. Meanwhile, on the daily chart, the 20SMA ($4,159.7) has already crossed above the 50SMA ($4,147.2), so around $4,163 can be considered a key medium-term support level. The above information is for reference only and does not constitute investment advice.
2026-08-12
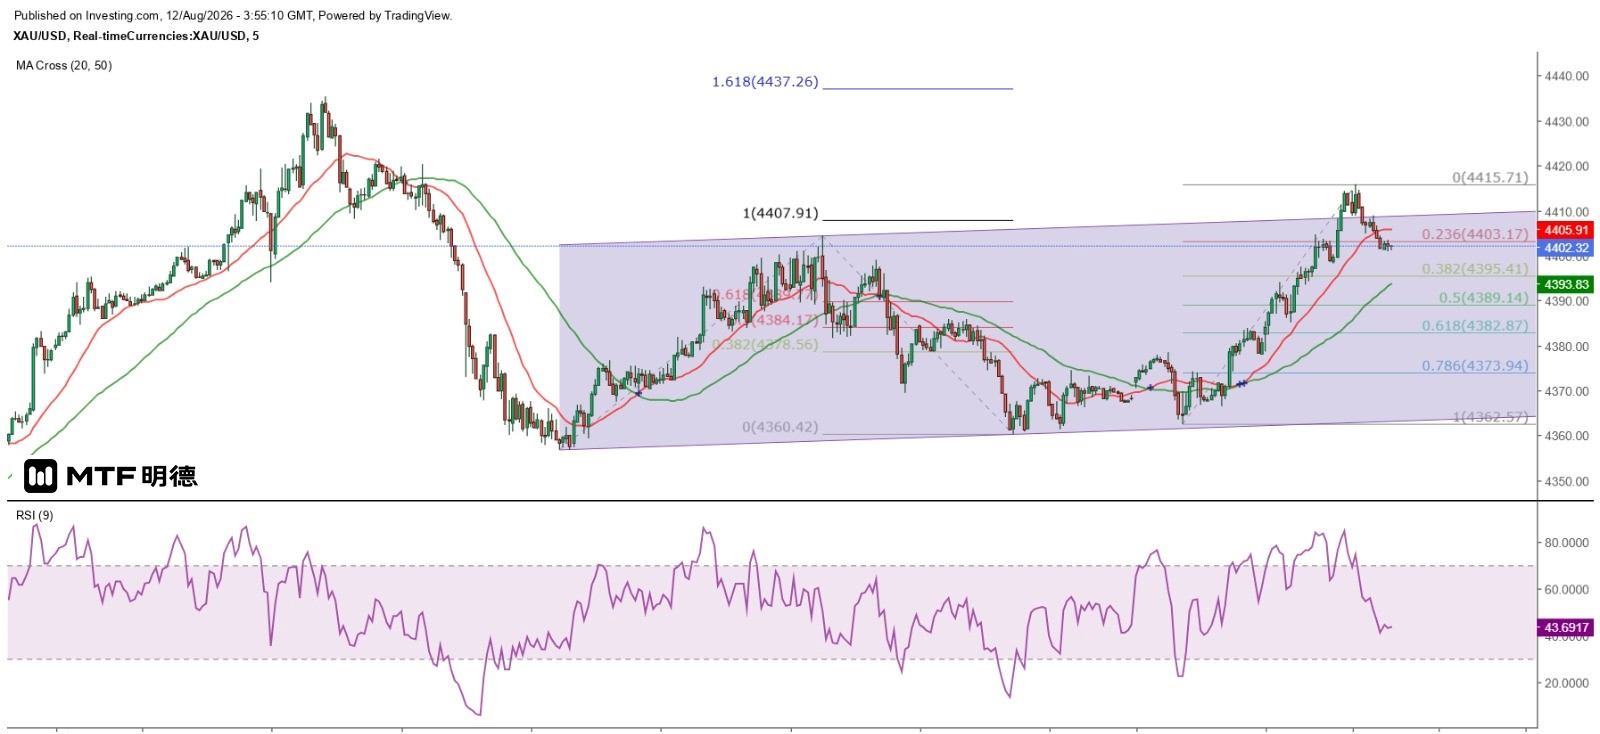
"Gold Price Likely to Remain Range-Bound in the Short Term" Completed on 12/8/2026 at 11:54 Yesterday, gold prices surged early in Asian trading to a high of $4,435.33 before retracing sharply and fluctuating significantly. The price action formed a narrowing triangle pattern, with the day's low hitting $4,356.87 during the initial phase of European trading, while the rebound peak reached $4,404.43 shortly after New York opened. However, today in early Asian trading, gold regained momentum, breaking above yesterday’s New York rebound high to reach $4,415.71. The earlier forecast for gold movement was fairly accurate. Although prices broke through the $4,410 level—the Gann 270-degree vertical angle—and the 50% retracement level of the recent mid-term downtrend at $4,416.97, they did not advance far beyond. The lows remained only about $6 below yesterday’s indicated support level of $4,362.12. On the 5-minute chart, gold briefly dipped to $4,360.42 this morning before recovering. It has since pulled back from $4,415.71 and is currently testing the 20SMA (currently around $4,405), likely to next test the 50SMA (around $4,391). Moreover, since yesterday’s European session, gold has generally moved within a balanced ascending channel, ranging between approximately $4,360 and $4,410. Tonight, the U.S. Department of Labor will release July CPI data, expected to show an annual increase of 3.4%. As long as inflation does not drop significantly toward 3%, $4,410 will remain the key resistance level. I anticipate that if gold remains strong, it will continue to trade above $4,360, with the $4,410–$4,460 zone acting as resistance, while the $4,360–$4,310 range will serve as support. Gold is expected to continue moving within this short-term range-bound pattern. The release of tonight’s July CPI data increases the likelihood of further pullbacks! The above information is for reference purposes only and does not constitute investment advice.
2026-08-11
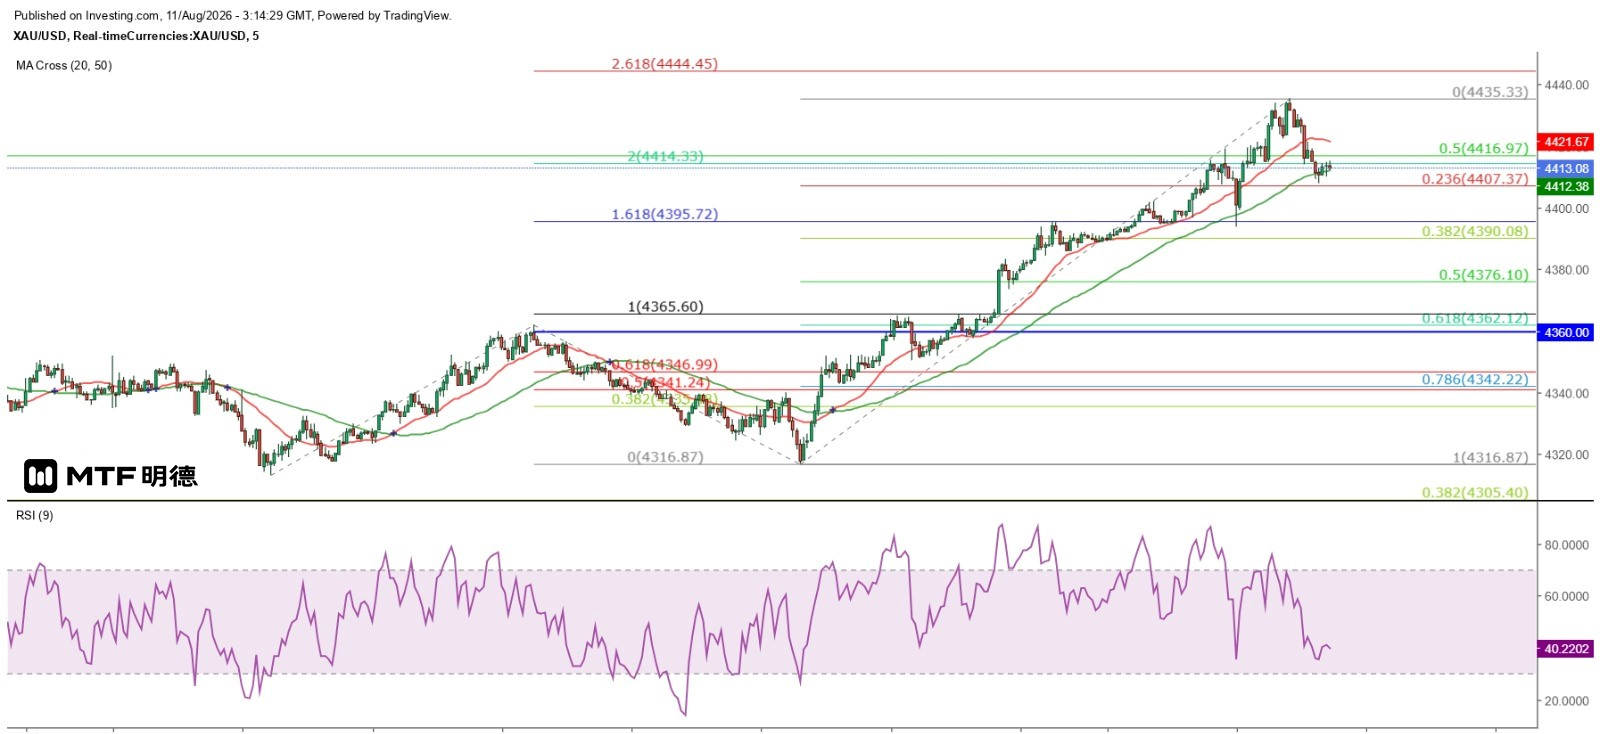
"High Chance of Gold Reaching a Peak Today" – Completed on 11/8/2026 at 11:12 The weakening U.S. labor market has provided investors with a reason to sell the dollar. On August 5, following weaker-than-expected July ADP private employment data, gold prices broke above the daily chart's 50-period SMA (currently around 4,150), gaining momentum. This morning during early Asian trading, gold surged as high as $4,435.33—breaching both the Gann square’s 270-degree vertical angle at $4,410 and the 50% retracement level of the largest drop since April 17 at $4,416.97. However, it subsequently pulled back repeatedly and remains temporarily above $4,410. Nevertheless, attention should be paid to tonight’s release of the U.S. July CPI data. Market expectations are for the year-on-year increase to decline from 3.5% to 3.4%. Even so, inflation would still remain above the 3% threshold, leaving little justification for rate cuts. Moreover, the Federal Reserve does not base its monetary policy solely on one month’s employment data. Additionally, tensions between the U.S. and Iran could worsen again, as both sides demand compensation for losses and casualties caused by military actions. This has pushed New York crude oil prices back above $80. If the Strait of Hormuz continues to face prolonged disruptions in shipping capacity, oil prices could rise further, which would likely push gold prices lower. Looking at the 5-minute chart, gold is currently testing the 50SMA (currently around $4,411) for the second time this morning in Asian markets. A confirmed close below this line would likely trigger a rapid decline. If the correction reaches 61.8% of yesterday’s overnight rally in New York, gold could fall to $4,362.12—roughly within the range between the strong resistance at $4,410 and weak support at $4,310. Judging by short-term cyclical patterns, gold appears to have peaked today, and is expected to trend downward over the remainder of the week. Even if it holds steady above $4,410 in the near term, a challenge toward $4,460 remains possible only if U.S. inflation drops sharply below 3%. Otherwise, the likelihood of reaching the 61.8% retracement level of the largest drop since April 17—$4,528.53—is slim. The above information is for reference purposes only and does not constitute investment advice.
2026-08-10
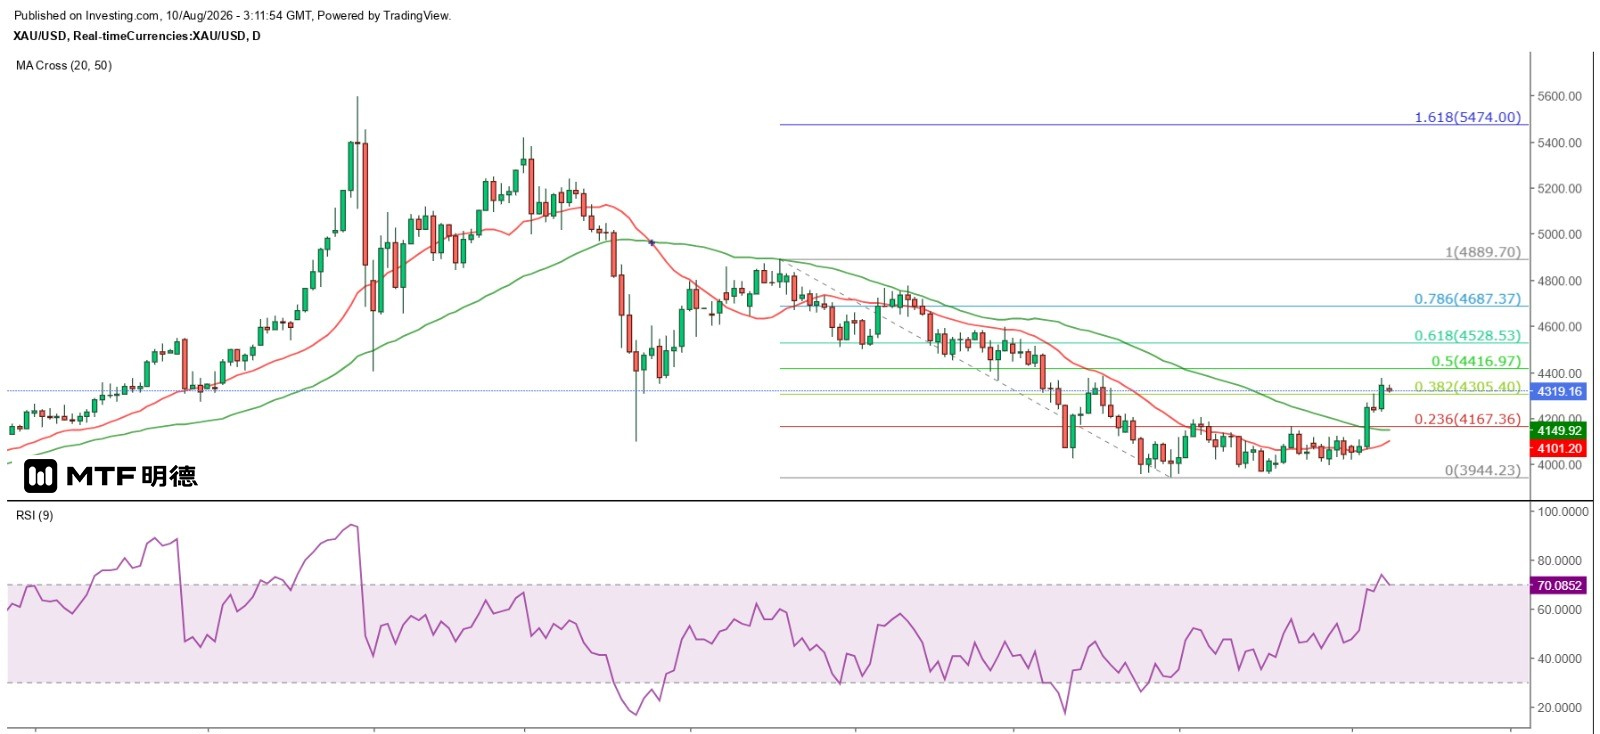
"50-Day Moving Average of Gold Price Provides Strong Medium-Term Support" Completed on October 8, 2026, at 11:10 AM Last Friday's U.S. July employment data came as a disappointment. Nonfarm payrolls fell by 23,000, sharply diverging from the market's expectation of an increase of 88,000. This marked the second consecutive month of job losses this year, following a downward revision in June’s job gains—from 57,000 to just 20,000. Additionally, private-sector job growth added only 30,000 positions, well below the expected 78,000. As a result, the overall decline in employment was driven by government sector cuts of 53,000 jobs—the fourth consecutive month of reductions in public-sector employment. Although the unemployment rate dropped by 0.1 percentage point to 4.1%, the unexpected decline in nonfarm payrolls left markets deeply disappointed. The drop in jobs was unforeseen and thus not previously priced in, triggering significant volatility across financial assets. Investors who had been bullish on the dollar naturally cut their positions to manage risk, while traders who had held back before the release seized the opportunity to sell aggressively. Consequently, the U.S. dollar plummeted, gold prices surged, and U.S. equities rallied sharply. However, based on personal experience, the short-term market impact of U.S. employment data—whether strong or weak—is typically absorbed within half an hour. Indeed, after the spot gold price jumped from $4,309 to $4,371.89, it began to retreat, reaching its intraday high just 15 minutes after the data release, followed by a gradual pullback. In New York afternoon trading, prices traded sideways above $4,327. The dollar did not collapse significantly, which I believe is due to two main factors: first, the nonfarm payroll change exceeded expectations by over 100,000, possibly influenced by special circumstances; second, although government jobs declined, private-sector employment still increased. Moreover, markets will now closely watch the Federal Reserve’s stance—whether it shifts focus from inflation to the labor market, or continues prioritizing inflation control. From a technical perspective, examining the daily chart, last Friday’s sharp rise in gold reversed more than 38.2% of the decline since April 17, bringing prices closer to the 50% retracement level at $4,416.97, which acts as a major resistance zone. From Gann Square analysis, $4,410 lies at the 270-degree vertical angle, making it highly likely that gold will face strong resistance between $4,410 and $4,416, potentially triggering another substantial pullback. Nevertheless, gold has clearly broken above the 50-day SMA (at $4,150), indicating a clear medium-term upward trend. This moving average will now serve as a robust support level during any short-term correction. Therefore, traders should consider selling gold around $4,410–$4,416, while buying near the 50-day SMA. More advanced traders may engage in high-selling and low-buying strategies between these levels, but overall, a strategy of buying on dips remains advisable. The above information is for reference only and does not constitute investment advice.
2026-08-07
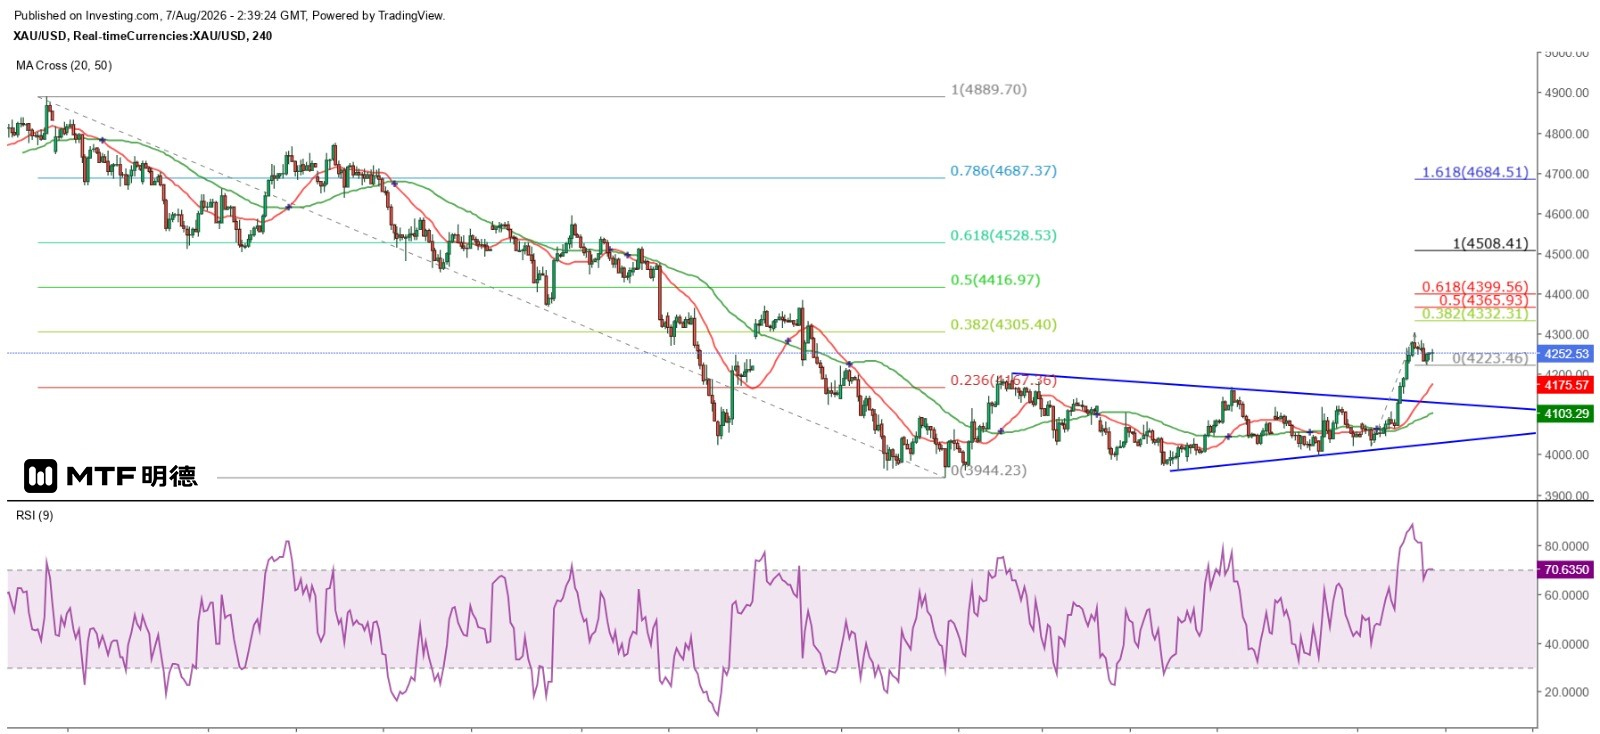
Non-Farm Data May Further Boost Gold Prices July 8, 2026, 10:38 AM Gold has clearly broken above the 50-day SMA on the daily chart (currently around $4,151), signaling a mid-term upward trend. The next potential targets are $4,417 and $4,528, while the 50-day SMA may act as a key support level during short-term corrections. In the near term, after a sharp rise, gold experienced a pullback—yesterday, spot gold dipped to $4,223.46 in mid-New York trading, down more than $80 from its earlier high. On the hourly chart, gold prices broke below the 20-period SMA (currently around 4254) near yesterday's New York midday session, then traded in a narrow range. This morning, during early Asian trading, prices rebounded to $4253.35 and moved above the 20-period SMA. Although gold has been declining from yesterday's high, forming a short-term bearish pattern, examining the trend since August 3 reveals an ascending flag formation. Notably, the cumulative decline from the peak is just slightly more than 23.6% of the prior upward move, falling short even of the 38.2% level. Therefore, this correction is likely only a short-term adjustment rather than a significant weakening trend. Tonight, the U.S. Department of Labor will release the July non-farm payroll report, with expectations of 88,000 new jobs, an unemployment rate steady at 4.2%, and average hourly earnings rising by 0.3% month-on-month. Only a significant increase in employment—such as 150,000 or more—combined with a further decline in the unemployment rate, could reignite market expectations for Federal Reserve rate hikes and put downward pressure on gold prices. Conversely, if job growth remains below 100,000, the unemployment rate stays unchanged or even rises, and interest rates are expected to remain stable or gradually trend lower, gold is likely to strengthen steadily. Under such conditions, gold could rise toward $4,365 and $4,400, with a potential pullback expected if it reaches $4,508. The above information is for reference only and does not constitute investment advice.
2026-08-06
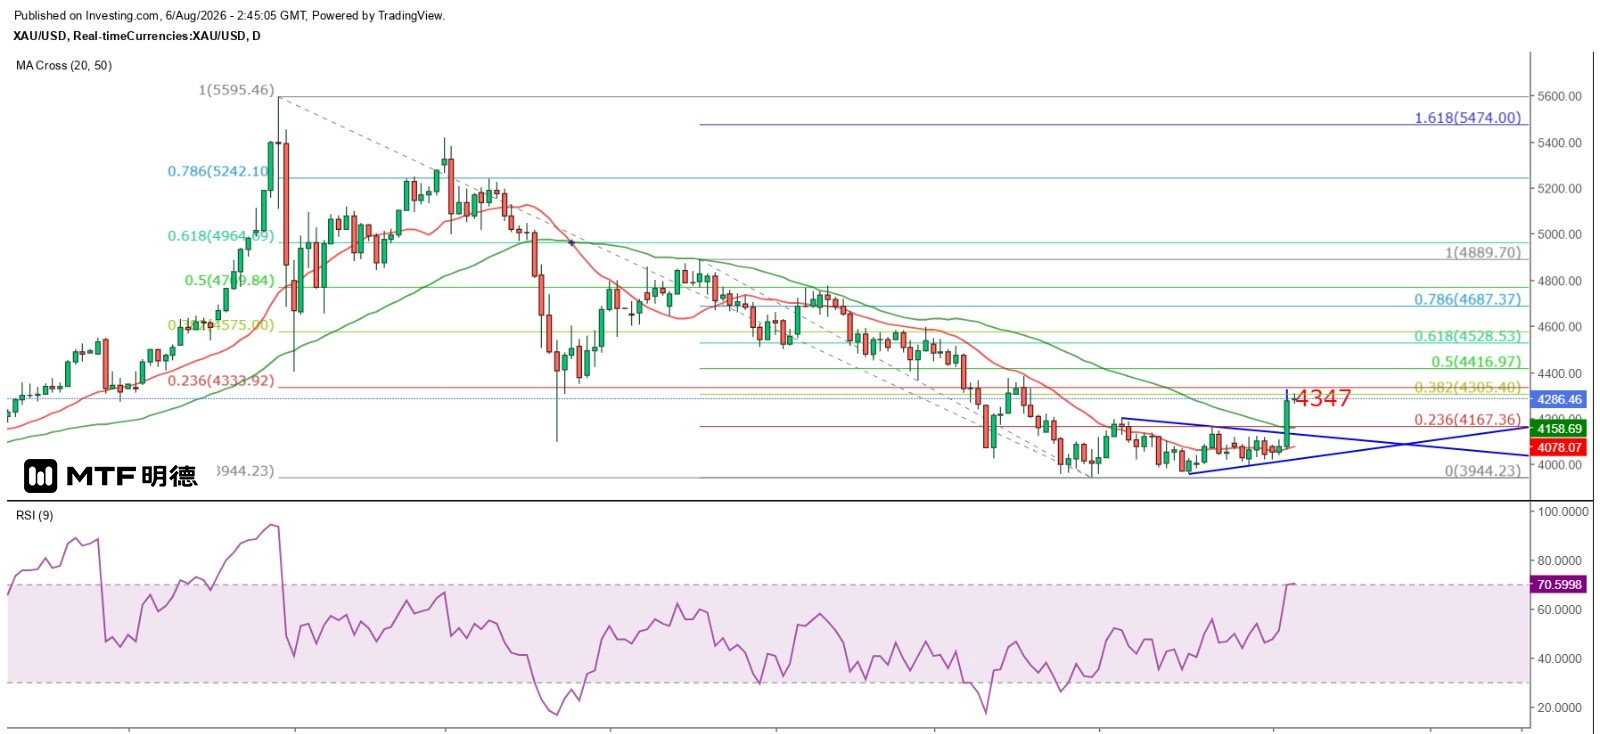
"Gold Prices Surge Sharply—Beware of Correction" 6/8/2026 10:44 Completed After months of turmoil, the market has chosen to accept the easing of tensions between the U.S. and Iran—or perhaps Trump's desire to avoid letting Middle Eastern geopolitical developments affect the midterm elections—leading him to halt further military action against Iran. Moreover, there remains strong domestic opposition in the U.S. to military strikes on Iran. With less than three months remaining before the midterms, it is believed that the U.S. will temporarily accept Iran and Oman each controlling the northern and southern passages of the Strait of Hormuz, aiming to prevent escalating U.S.-Iran tensions from dragging down Republican prospects in the midterm elections. Trump has consistently opposed imposing fees on vessels using the Strait of Hormuz, so whether the situation truly stabilizes will ultimately depend on the outcome of the U.S. midterm elections. If Republicans retain control of both the Senate and House after the midterm elections, it is almost certain that the U.S. will continue to take a firm stance toward Iran. Should Iran and Oman announce tolls for vessels using the Strait of Hormuz, this would likely provoke a strong military response from the United States. For now, markets can only hope that the 60-day temporary agreement will bring a period of calm to financial markets. Although free passage through the Strait of Hormuz may not resume immediately, shipping routes are expected to be restored soon. Once data shows a significant increase in crude oil shipments via this route, oil prices are likely to face further downward pressure, while gold prices will rise further. Yesterday, spot gold prices unusually showed a one-sided upward trend throughout the day, rising steadily from an Asian market low of $4,065.54 to reach a high of $4,267.71 during New York midday trading. It failed to pull back significantly afterward and further advanced this morning in Asian markets to hit $4,304.15. From a Gann square perspective, gold has broken through the strong 180-degree resistance at $4,210 and is now approaching the weaker resistance at $4,310. Therefore, it can be temporarily concluded that gold has stabilized above $4,210 and is likely to target the strong 270-degree vertical angle resistance at $4,410. However, caution is advised: gold is expected to briefly peak tomorrow. If the current upward momentum continues, early next week may bring significant downward pressure, with prices potentially falling near $4,120 before resuming their upward movement. On the daily chart, gold has broken above the 50SMA (currently around 4159), suggesting a new upward wave is expected. However, there may still be a short-term pullback to consolidate first. Buyers could consider entering once the price retraces to the 50SMA. The first intermediate target would be approximately $4,417, which corresponds to a 50% retracement of the decline that began on April 17. The second and third targets are seen at $4,575 and $4,770, respectively. The above information is for reference only and does not constitute investment advice.
2026-08-05
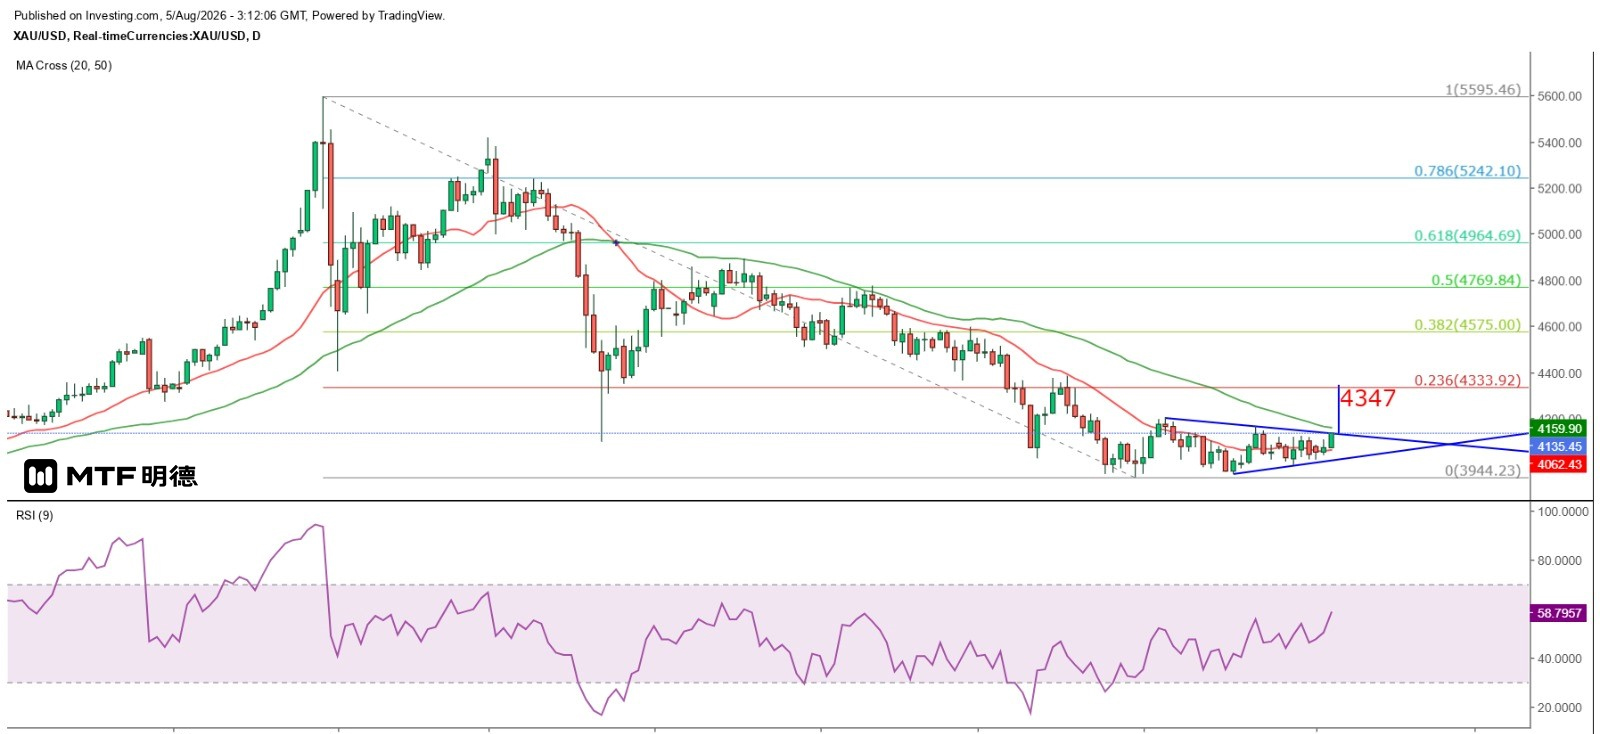
Gold Price Rally Expected to Continue May 8, 2026, 11:11 AM According to foreign media citing two sources and a U.S. official, the United States, Iran, and Oman are close to reaching a temporary agreement aimed at reopening the Strait of Hormuz, with the U.S. expected to announce the deal today. The preliminary agreement reportedly grants Iran certain control over traffic in the Strait of Hormuz before any potential conflict breaks out. However, the temporary accord is valid for only 60 days, though this period may be extended. Under the interim agreement, all vessels entering the Gulf via the Strait will pass through Iranian waters along the northern route, while vessels departing from the Strait into the Arabian Sea will travel along the southern route through Omani waters after coordination with Iran, without having to pay any fees during this 60-day period. Additionally, both sides will clear mines from the central channel of the Strait within 30 days; once completed, this route will serve as the designated shipping lane according to a permanent agreement soon to be negotiated between Oman and Iran. Stimulated by news developments, gold prices rose repeatedly yesterday in New York, with spot gold reaching a high of $4,105.8. As seen on the hourly chart, prices subsequently pulled back from their peak and dipped as low as $4,065.54 during this morning's Asian session. However, they quickly rebounded, not only achieving yesterday’s projected target of $4,124 but also breaking through the upper resistance of the recent sideways range, hovering around $4,130. On the daily chart, gold has approached the extended resistance line of the downward trend since July 6. With tensions between the U.S. and Iran gradually easing, oil prices are expected to decline further, alleviating inflationary pressures and reducing the likelihood of global central banks raising interest rates. This could support further upside for gold. In the short term, the next key target is the 50-period SMA on the daily chart (currently around $4,159). If gold breaks above and holds above $4,210, it could open up even greater room for further gains. The above information is for reference only and does not constitute investment advice.
2026-08-04
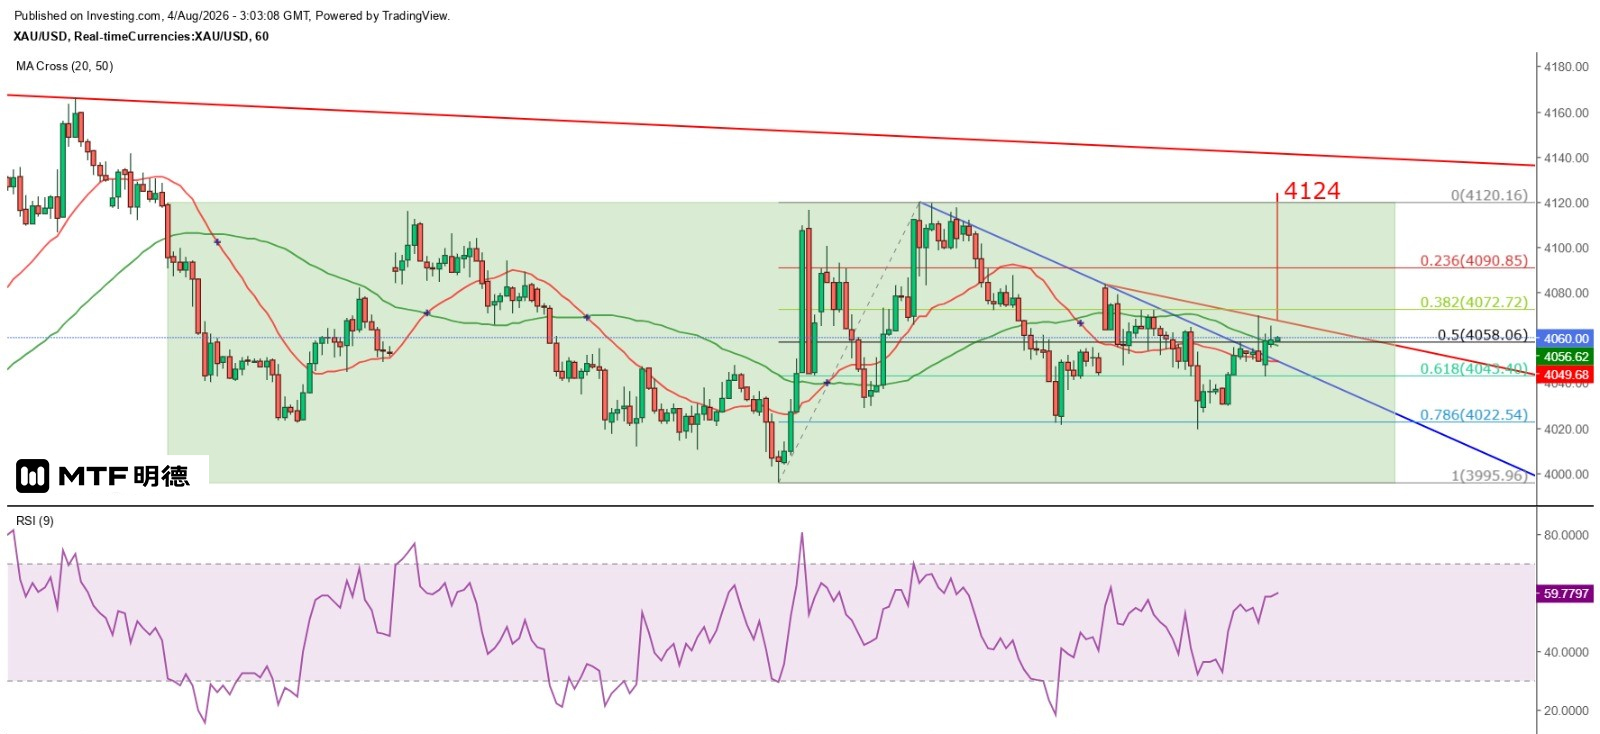
"Higher Chance of Gold Price Breaking Above 4,120" – Completed on April 8, 2026, 11:02 With Trump postponing a new attack on Iran, market expectations have shifted toward the possibility of renewed negotiations between the two sides. As a result, international oil prices declined and gold prices rose. On Monday, New York crude futures opened lower with a gap down, falling below $80 at one point to hit a low of $78.46 before hovering around $81 currently. Meanwhile, spot gold initially dipped to $4,019.2 in early trading in New York yesterday, then stabilized and rebounded during the midday session after consolidating at lower levels. Overall, gold prices continue to fluctuate around the 20SMA on the daily chart (currently at approximately 4059). This morning, they reached a high of $4069.45 in early Tokyo trading and once again broke above the 50SMA on the hourly chart (currently at around 4057), suggesting a potential strong rebound. According to TD count analysis, if gold confirms a breakout above the descending trendline resistance on the hourly chart, the next target would be around $4124—slightly above the resistance level of $4120, which marks the upper boundary of the main price range since July 24 on the hourly chart. Observing the price range, gold is currently near the midpoint of the aforementioned sideways zone (4058.06). Although theoretically the chances of moving up or down are equal, the hourly chart shows that three recent lows are extremely close together, suggesting a sense of hesitation—either falling further or rebounding. Therefore, it is more likely that prices will continue to rise. In the short term, the key resistance level is at $4,120. However, once this level is breached, a significant number of stop-loss orders are expected to trigger, further pushing prices higher. As such, we anticipate stronger resistance at the Gann square's 180-degree angle at $4,210. For intraday trading, buying on dips remains the primary strategy. The above information is for reference only and does not constitute investment advice.
2026-08-03
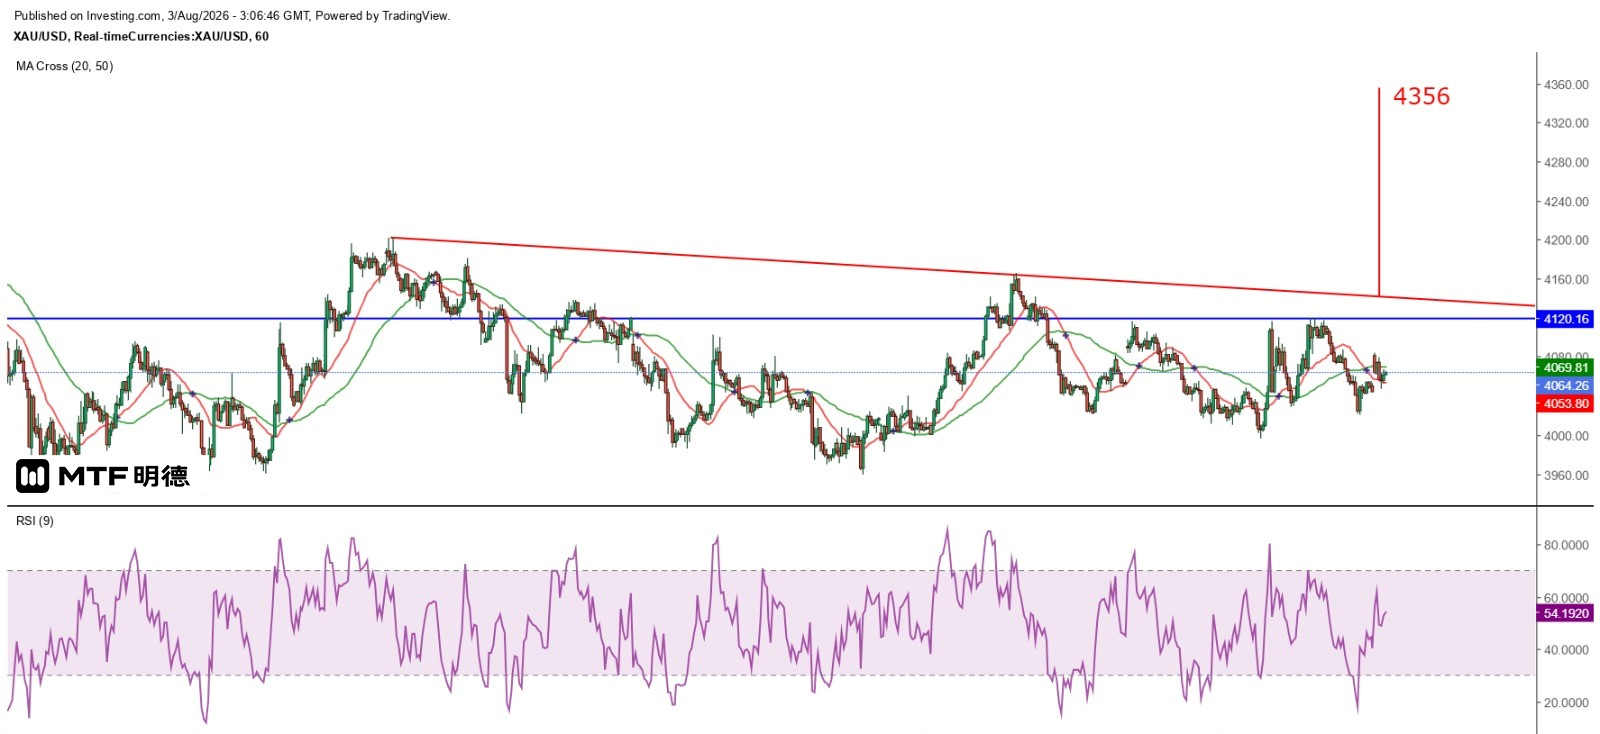
Gold prices show short-term tendency toward volatile gains March 8, 2026, 11:04 AM The situation between the U.S. and Iran remains deadlocked, with both sides issuing conflicting statements. Iran insists that the Strait of Hormuz will not return to its pre-war state, while Trump claims there is already an agreement regarding the strait. The large-scale attack on Iran originally planned for last night has been canceled at the request of Saudi Arabia, the UAE, Qatar, and Iran. He further believes that an agreement on denuclearization will also be reached. Gold prices have entered a sideways consolidation phase. Since falling below $4,120 on July 23, spot gold has remained within a range of $3,995 to $4,120. Although this morning's price surged higher following Trump's renewed "TACO" move, the market reaction differed significantly from previous instances. After briefly reaching $4,083.77, gold quickly reversed and dipped as low as $4,047.56 before stabilizing. On the hourly chart, there are signs that gold is holding above the 20-period SMA (currently around $4,054). On the five-minute chart, a cluster has formed above the 20-period SMA ($4,055), suggesting potential for an upward breakout. However, the short-term resistance remains at $4,120; only a breakout and sustained hold above $4,110 would open the door for further advancement toward $4,210. Currently, the daily chart of spot gold still shows a narrowing triangle pattern. If today's price can break above $4,143 (without needing to close), it could signal an upward breakout, with a projected target around $4,356 based on the TD line measurement. On the intraday level, the 20-period SMA on the hourly chart serves as the primary support. Should the price fall below $4,043, it would be advisable to cut losses or set stop-loss orders accordingly. The short-term strategy should focus mainly on buying on pullbacks, with expectations of continued sideways-to-upward movement in the near term. The above content is for reference only and does not constitute investment advice.
2026-07-31
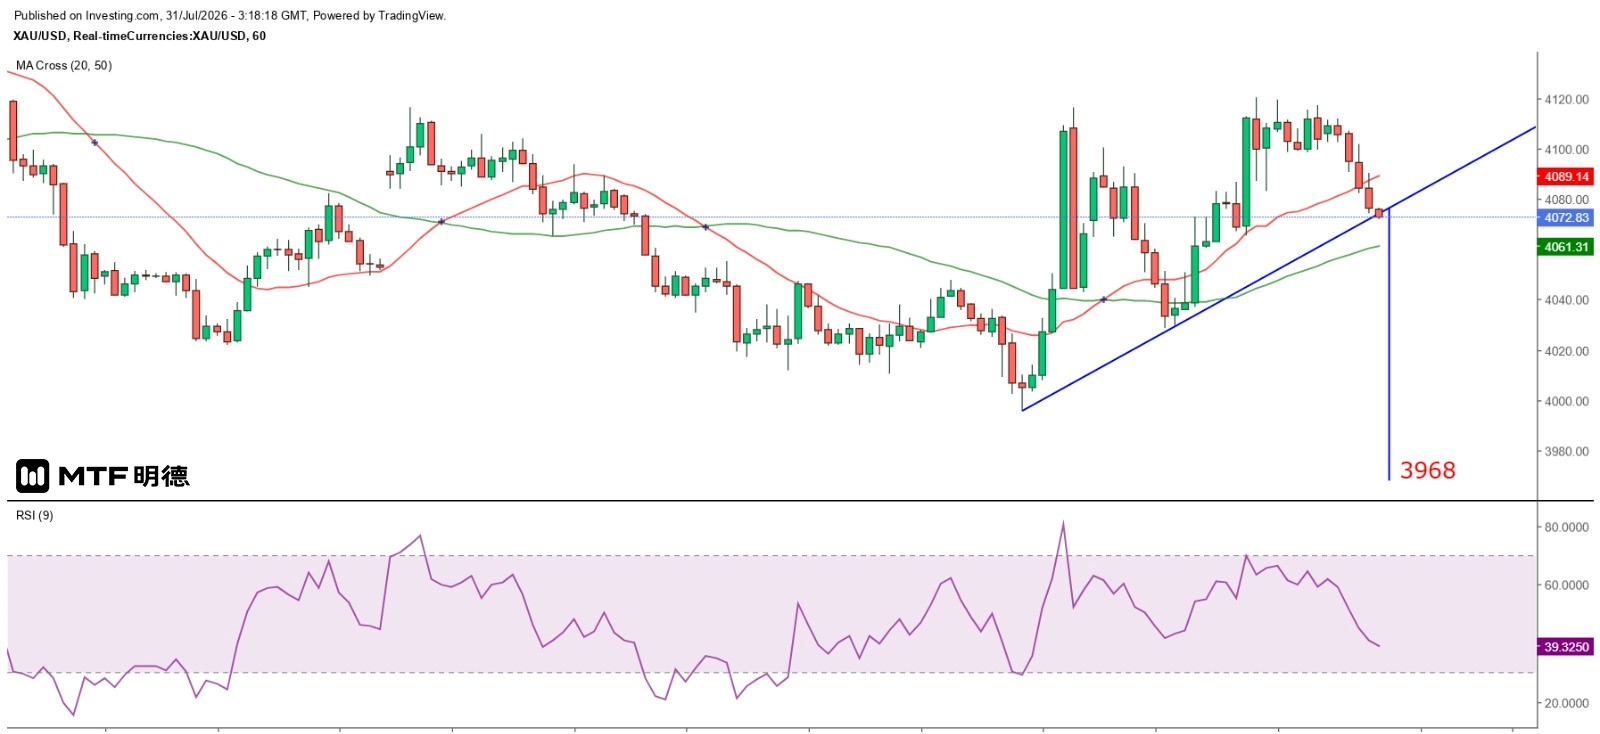
Gold price likely to test lower levels intraday 31/7/2026 11:17 Completed Yesterday, the U.S. released its second-quarter GDP preliminary estimate, showing a year-on-year quarterly growth of 1.5%, down from 2.1% in the first quarter. Non-residential investment growth slowed from 10.6% in Q1 to 8.4%, while AI-related industry growth decelerated from 13.8% to 8.8%. Exports declined from 10.9% to 4.5%, whereas consumer spending increased more sharply, expanding from 0.5% to 3.2%. Nevertheless, overall data indicates a slowdown in economic growth. Data briefly boosted gold prices, with spot gold reaching $4,120.16 early in New York trading—slightly surpassing the high set after the Federal Reserve's interest rate decision. However, amid rising expectations of a rate hike, gold maintained its upward momentum and held firm at higher levels before declining again this morning in Asian markets, falling back below $4,100. As seen on the hourly chart, since the start of this week, gold has attempted three times to break above $4,110 but failed each time, indicating that it will likely remain stuck in a sideways consolidation pattern in the short term. Tonight, the U.S. will release the July University of Michigan Consumer Sentiment Index, expected to rise from 49.5 to 54.4, moving back above the neutral threshold. If the data indicates stronger consumer confidence and subsequent inflationary pressure, the likelihood of a Federal Reserve rate hike would increase, further weighing on gold prices. Gold is expected to remain under pressure today, testing lower intraday levels, with the hourly 50SMA (4061.34) likely serving as the first major support. The gold price is currently testing the upper trendline on the hourly chart. Although a false breakout is more likely, if the price closes below the 50SMA on the hourly chart over time, the downside target measured by the TD count would be $3,968, and a new TD demand line would need to be calculated only upon its formation. Even from the 5-minute chart perspective, gold remains constrained by the 20SMA, and a reversal of the downtrend seems unlikely before the price breaks above the 50SMA (currently around $4,091). The key resistance level for the day remains at $4,110. The above information is for reference only and does not constitute investment advice.
2026-07-30
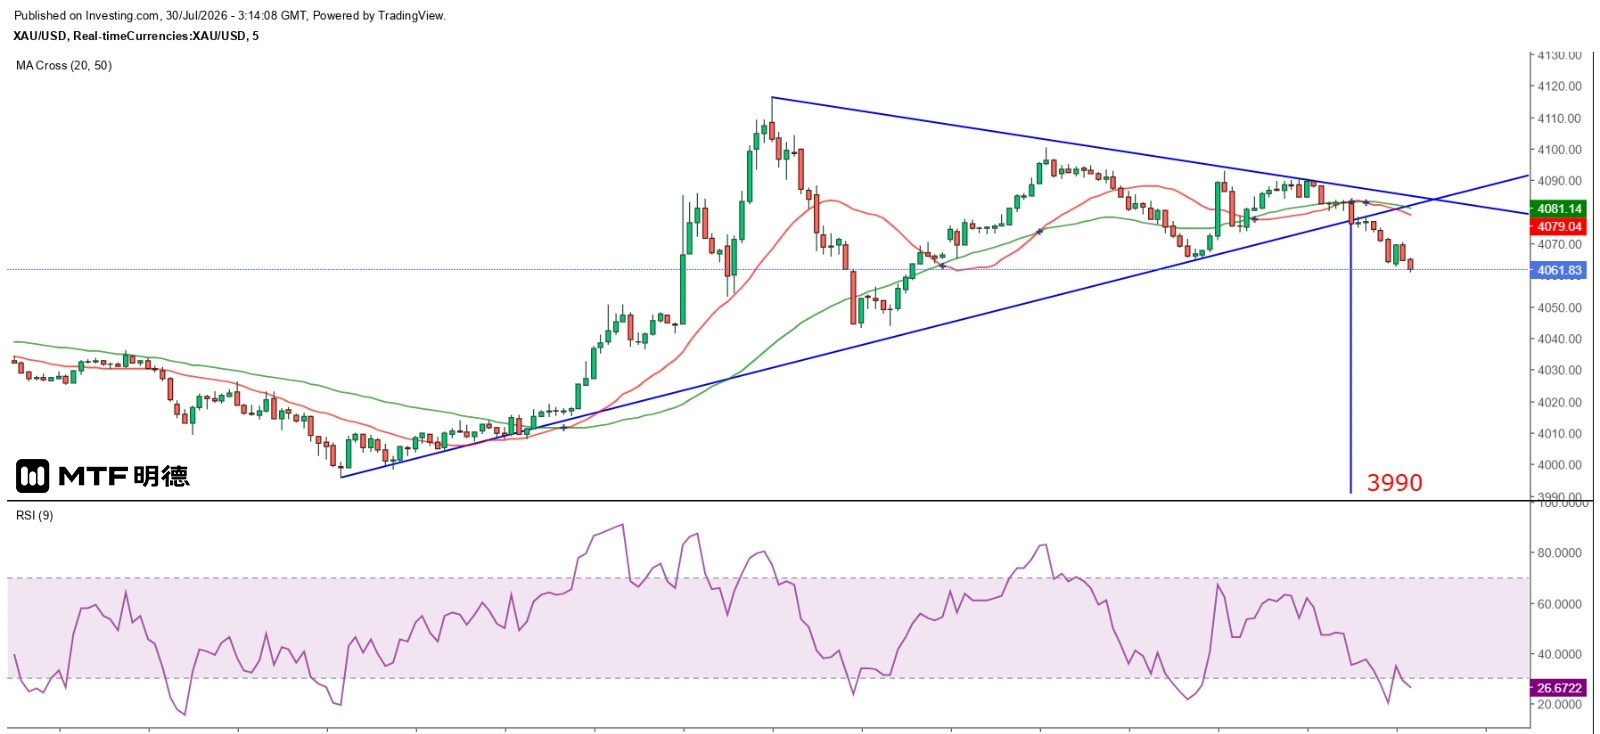
Gold price likely to test $4,000 level again – July 30, 2026, 11:12 AM As expected, gold prices rebounded sharply. Following the Federal Reserve's FOMC interest rate decision yesterday, spot gold surged to a high of $4,109.26, then further climbed to $4,116.44 before sharply correcting and erasing all gains made after the rate announcement. As of early Asian trading today, the price has formed a narrowing triangle pattern awaiting a breakout. It should be noted that the FOMC decided by a 9-to-3 vote to keep the federal funds rate between 3.5% and 3.75%, with three members supporting a 25-basis-point hike—the highest number of votes in favor of a rate increase since September 2016. Yet, gold prices rose instead of falling, which I believe was due to profit-taking and short covering. Typically, investors seeing three votes in favor of a rate hike would anticipate the Fed's earliest possible tightening in September, prompting them to buy dollars and sell foreign currencies and gold. However, gold prices had already been declining for some time before the interest rate decision was announced. The spot price dropped as low as $3,995.96 in early trading in New York. Since the start of this week, gold reached a high of $4,116.16 on Monday during Asian morning sessions, marking a cumulative drop of $120.2 so far this week. In other words, after returning to its previous level yesterday, gold has resumed its downward trajectory. With the price forming a narrowing triangle pattern and the rate decision increasing the likelihood of a September rate hike, the chances of breaking above $4,110 have diminished, while the probability of testing below $4,000 again has risen. Currently, only if the U.S. inflation rate drops below 3% will the FOMC members be likely to reconsider the timing of interest rate hikes or whether to maintain rates unchanged. Based on this, gold prices are expected to fluctuate between $4,000 and $4,110 throughout August, with significantly increased volatility. As seen on the 5-minute chart, gold has broken below the ascending trendline of a narrowing triangle, suggesting further downside pressure during the day. The first key support level is at $4,043, and there remains a high probability of another test of the psychological $4,000 level. The above information is for reference only and does not constitute investment advice.
2026-07-29
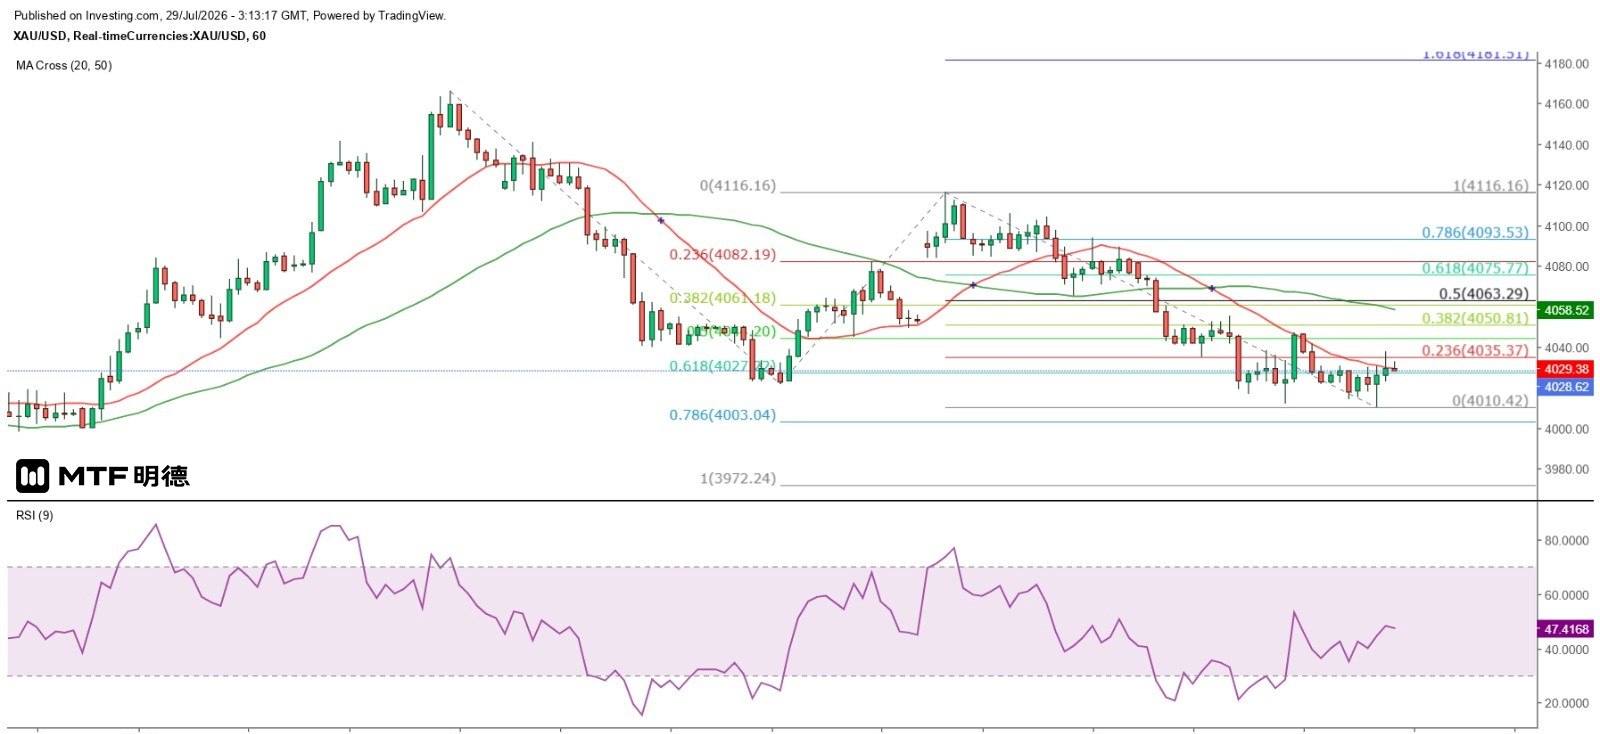
Gold price expected to bottom out and rebound today July 29, 2026, 11:12 AM Gold prices were under pressure for most of yesterday. After falling to a low of $4,011.92 during early trading in New York, spot gold recovered slightly, rising to $4,047.16 before encountering resistance at the 20-day moving average (currently around $4,030), which triggered another decline. This morning, prices tested below yesterday's low, dropping to $4,010.42 before recovering again. Currently, gold is trading above the 20-day SMA. The U.S. Federal Reserve will release its interest rate decision tonight, with expectations that the federal funds rate target range will remain unchanged at 3.5% to 3.75%. Gold prices are likely already priced in this outcome, and the accompanying statement will influence short-term market movements. From the Gann Square perspective, the low level touched by gold this morning coincides precisely with a strong support (or strong resistance) at the 90-degree angle. Therefore, a powerful rebound after gold fell to the $4,010 level was almost inevitable—provided we rule out the possibility of a major downward breakout. In practical trading, there is only one scenario where a counter-trend position can be taken before a reversal signal appears in the candlestick pattern: when price has already reached a strong support level. However, I must emphasize that under no circumstances should investors enter the market without setting a stop-loss order beforehand, or immediately upon entry. Assuming gold remains above $4,010, the first resistance level for the rebound would likely be $4,110 (Gann's 135-degree angle), followed by the next strong resistance at $4,210. Judging from short-term cyclical trends, the weakest scenario for gold prices is a bottom forming by Friday this week before rebounding, while the best-case scenario would be a bottom today followed by an immediate recovery—this likely relates to the Federal Reserve's interest rate decision. Assuming a bottom has already formed today, a daily rebound target could be set at $4,063.29. Since the previous upward move slightly exceeded 61.8%, indicating strengthening upward momentum, if this current rally also reaches the 61.8% level, gold could climb to $4,075.77. On the other hand, if prices continue to decline, a potential downside target or endpoint could be $3,972.24, at which point a low-buy strategy may be considered. The above information is for reference only and does not constitute investment advice.
2026-07-28
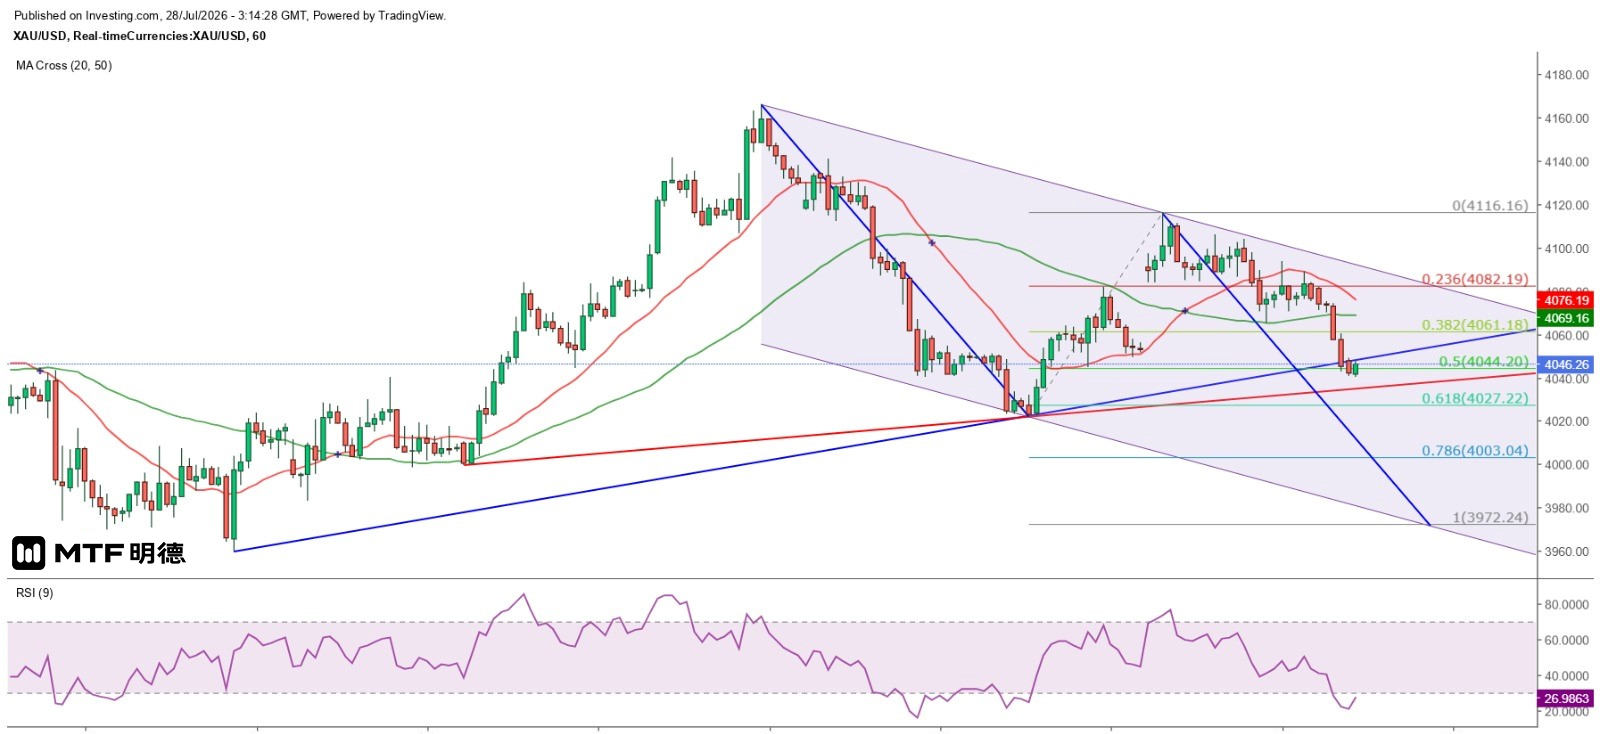
Gold price expected to fluctuate above $4,000 July 28, 2026, 11:13 AM (completed) Yesterday, the spot gold price failed to hold above $4,110. As seen on the hourly chart, after reaching a high of $4,116.16 during early Asian trading, the price lost momentum and subsequently formed a large bearish candle, breaking below $4,100. It then developed a descending flag pattern ahead of New York market open, falling further below the 20-period SMA (currently around $4,085) shortly after the New York session began, with prices dropping as low as $4,065.42. However, by the close of the New York session, the price remained below the 20-period SMA, forming a small rounded top pattern amid sideways fluctuations. In today's early Asian session, gold prices continued to decline, with the 50-period SMA on the hourly chart (currently around 4094) also broken, temporarily reaching a low of $4042.7. However, since July 17, gold has formed a narrowing triangle, and is currently positioned right at the extended support level of its ascending trendline. On a larger time frame—since June 30—gold has similarly been consolidating within a narrowing triangle. Of course, it could also evolve into a balanced descending channel pattern; using a Fibonacci extension of 100% from the recent drop, gold could potentially fall to $3972.24. The sudden drop in gold prices does not appear to be related to the U.S.-Iran situation, as oil prices are also falling. Therefore, the only plausible explanation is the upcoming Federal Reserve FOMC monetary policy meeting. The market remains uncertain about the stance of the new Fed chair, but one thing is certain: even though the latest U.S. inflation rate has declined from 4.2% in May to 3.5% in June, it still exceeds the upper threshold. Thus, even if the Fed does not raise interest rates, it would be unlikely to issue a dovish statement. It is therefore no surprise that gold prices retreated ahead of the rate decision. However, there is still room for gold prices to rebound. As long as the Federal Reserve maintains interest rates unchanged at this meeting and does not clearly signal a potential rate hike in the next one or two meetings—instead opting to monitor developments in the Middle East and their impact on oil prices and inflation—gold prices are likely to remain stable above $4,000 with fluctuations. For short-term bearish trades, it's advisable to set relatively tight stop-loss levels, such as just above the day's high or above the highest point of the past hour. Conversely, for bullish entries, investors should wait for clear upward signals before entering, or place stop-loss orders below the lowest level of the most recent hour. Currently, tensions between the U.S. and Iran remain volatile, while the Fed continues to adopt a cautious stance on monetary policy. Therefore, $4,000 remains a strong support level for gold, making a sharp breakdown below this level unlikely in the near term. The above information is for reference only and does not constitute investment advice.
2026-07-27
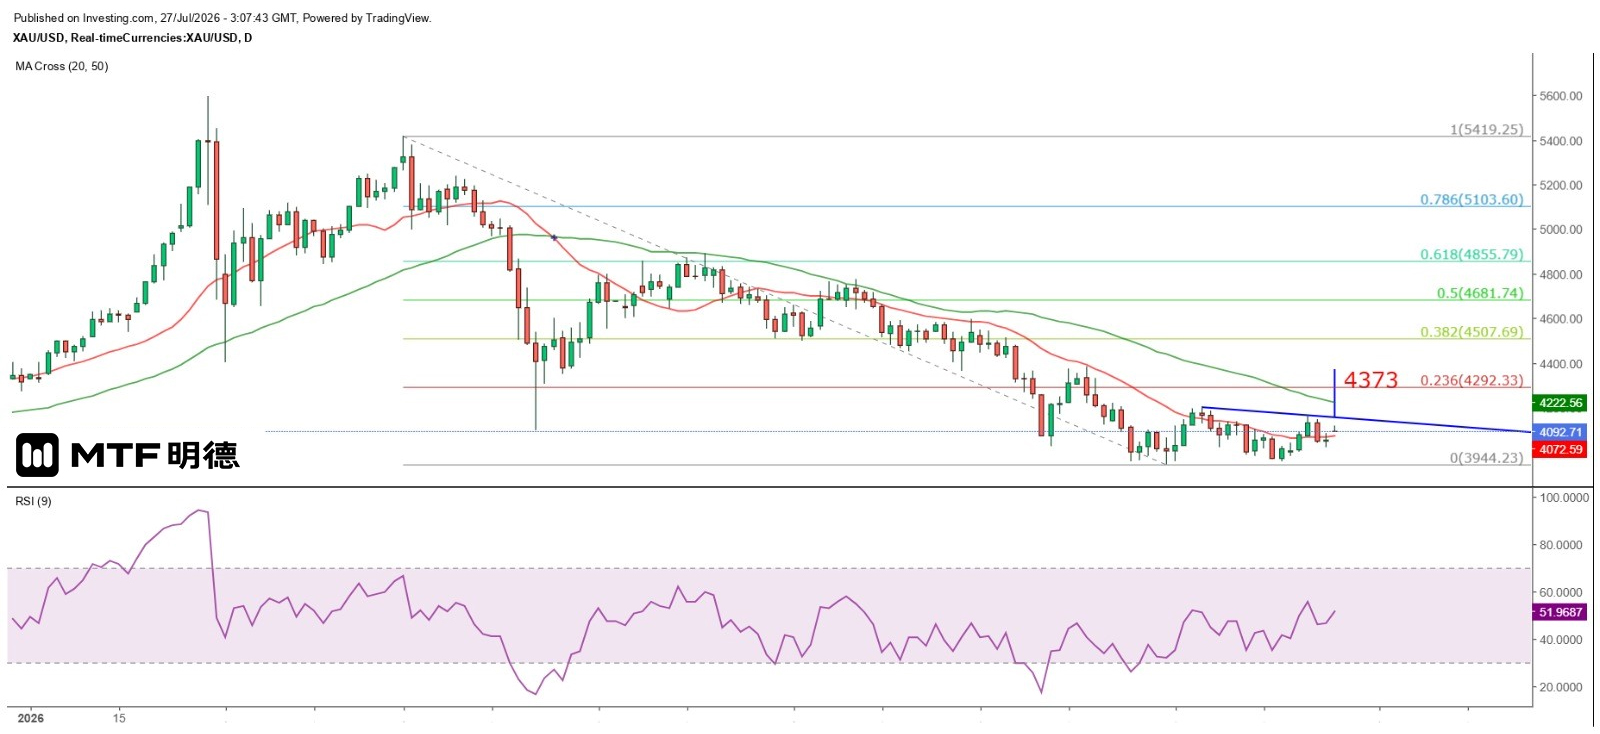
Gold price holds steady at 4,110 as upward trend continues July 27, 2026, 11:07 AM (completed) The United States began pausing its attacks on Iran late last Friday, and Iranian military officials also announced a halt to retaliatory operations. However, Yemen's Houthi rebels claimed they attacked Saudi Aramco facilities in the Red Sea port cities of Jizan and Yanbu on Saturday, though Riyadh and Saudi Aramco have not confirmed these reports. Iran's Foreign Ministry stated that communication between the two sides remains ongoing. The news triggered a sharp drop in Brent crude oil prices, which opened lower in today's Asian session with a gap down, briefly testing below $87 before recovering slightly to around $88. On Thursday, spot gold closed below the 20-day moving average (currently around 4073) on the daily chart. It further declined to a low of $4021.56 on Friday before recovering and closing at $4053.17. Stimulated by the aforementioned news, gold opened higher this morning in Asian trading with a gap up, rising above the 20-day moving average on the daily chart and reaching a high of $4116.16. Similarly, if gold closes above the 20-day moving average for three consecutive trading days, the credibility of an upward trend will increase. On the other hand, measured by the TD line, if gold prices rise above $4,157 today, even without a closing break, the projected upward target would be around $4,373. Therefore, maintaining a strategy of buying on dips remains the primary approach. The first key support level for the day is the hourly 50 SMA (currently around $4,071), and a short-term reversal point is expected this Wednesday (based on New York close). Coincidentally, that day also marks the release of the Federal Reserve's interest rate decision—caution is advised against a rapid drop in gold prices. Additionally, if gold manages to hold steady above $4,110 in the near term, attention should also be paid to whether a minor double top could form at $4,166. The above information is for reference only and does not constitute investment advice.
2026-07-24
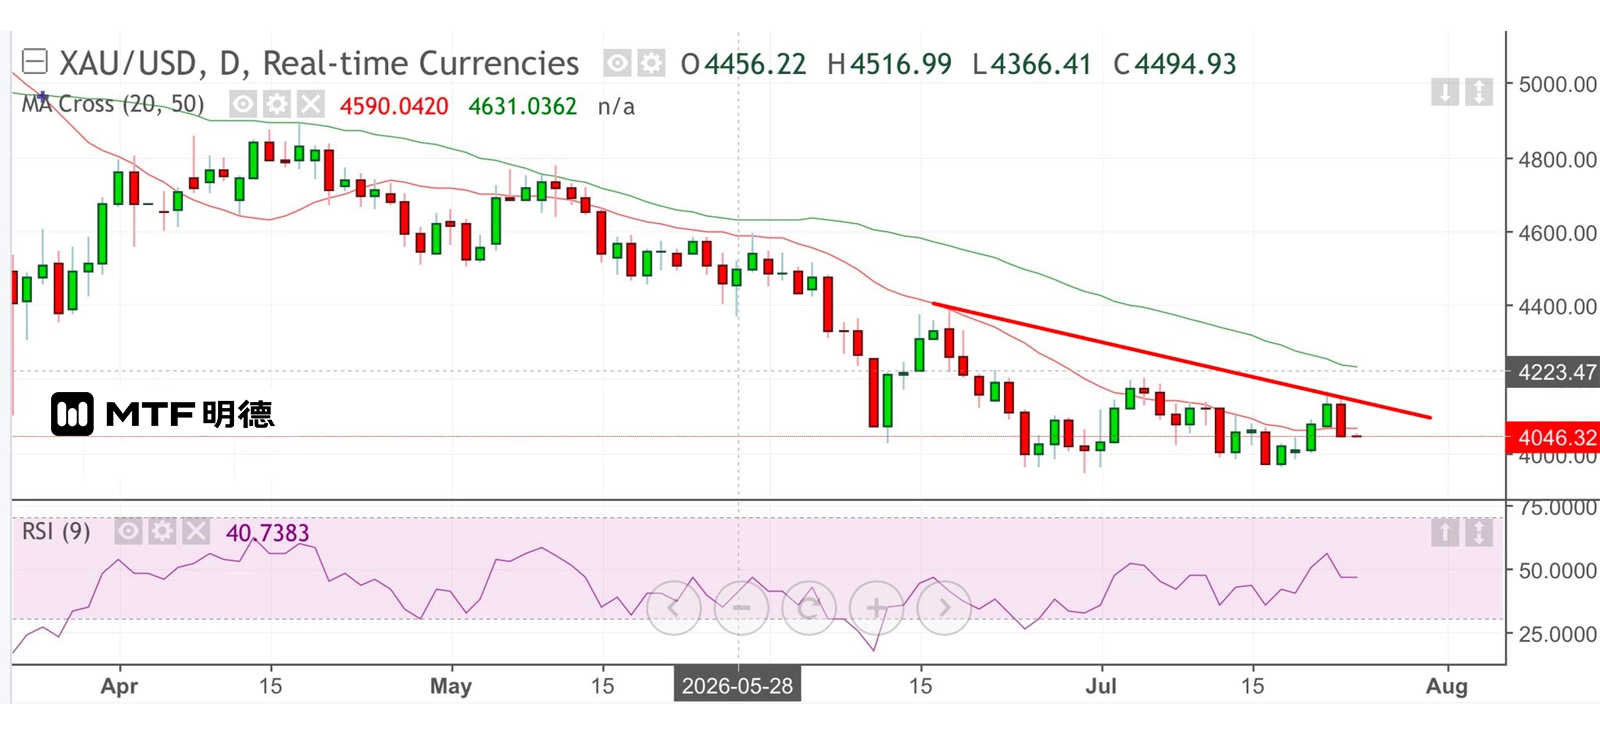
"Gold Price Reverses Sharply, But Double Bottom Pattern Unchanged" Completed on 24/7/2026 at 10:21 Yesterday, oil prices surged while gold prices sharply declined. The main reason was that Houthi rebels in Yemen, backed by Iran, used drones and missiles to attack two Saudi Arabian oil tankers in the Red Sea and simultaneously blockaded the Bab el-Mandeb Strait. This waterway is a crucial passage linking the Gulf of Aden to the Red Sea, through which 12% of global crude oil exports transit via the Suez Canal. With the strait now blocked by Houthi forces, crude oil supply has been disrupted. New York crude oil surged, reaching a high of $94, as concerns over inflation reignited worries about interest rate hikes, weighing on gold prices throughout the day. Spot gold fell below $4,120 early in yesterday's European session, and the decline intensified, dropping to a low of $4,041 during New York midday trading before stabilizing. However, there was no strong rebound, and in this morning's early Asian session, it peaked at only $4,050.75. Yesterday's sharp drop in gold prices prevented it from closing above the 20SMA (currently around $4,068) for three consecutive trading days, but did not break the double-bottom pattern on the daily chart. Now we need to watch whether Trump responds with strong measures—I believe that either the U.S. or Israel may launch a military strike against the Houthi forces, reopening the Bab el-Mandeb Strait. This would likely cause oil prices to decline and gold to rebound again. I still expect $4,000 to remain a strong support level for gold, and in the short term, prices are likely to fluctuate between $4,000 and $4,210. The above information is for reference only and does not constitute investment advice.


