
 en-US
en-US 

 Telegram
 WeChat

2026-06-25
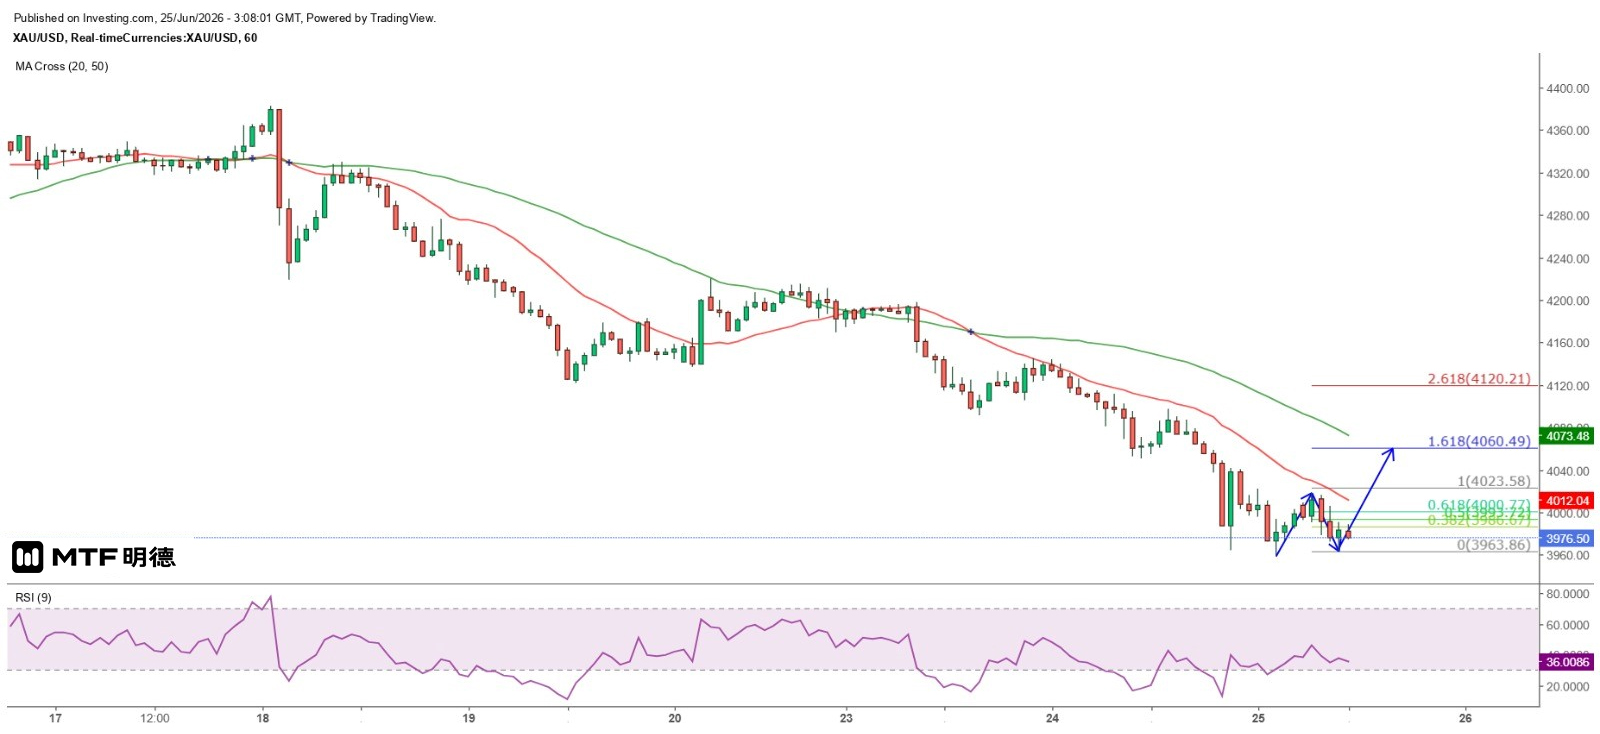
"Gold Price Forms Double Bottom, Rebound Expected If Not Broken" – Completed on 25/6/2026 at 11:05 The gold price has continued its decline, with spot gold falling below the $4,000 level and dropping as low as $3,959.38 before rebounding to $4,018.74. However, it ultimately failed to hold above $4,000, prompting another drop, with today's lowest point reaching $3,963.86. On the daily chart, the price movement shows a divergence with the 9RSI, forming a double bottom pattern. The corresponding 9RSI reading at the previous low was 17, suggesting a strong rebound wave is likely, as previously forecasted. The high of the June 17 rebound at $4,382.85 is now viewed as the neckline and potential target for this upward move. On the hourly chart, yesterday's gold rebound failed to break above the 20-period SMA (currently around 4017), which has clearly become the main resistance level for recent rebounds. After another decline, the price formed a small double bottom pattern, suggesting a potential intraday rally. If today's low does not fall below yesterday's low of $3959, a third wave could emerge in the short term. Assuming this third wave equals 1.618 times the first wave, gold could rise to $4060.49, approaching closely the 50-period SMA on the hourly chart (currently around $4077), where significant selling pressure is expected. However, at that point, $4010 is likely to re-emerge as a strong support level. If gold prices continue to decline, a strong rebound is expected only by next Monday. Also note that if gold closes below $4,550.5 this month, all gains since the beginning of the year will be erased. Since 2016, this has occurred only in 2021 and 2022, and gold subsequently showed weak performance. The 20SMA on the monthly chart (currently around $3,752) remains a key long-term support level. If gold retraces 38.2% of its largest gain since 2016, it would fall to $3,857.65—close to the 20SMA. Gold could then hold above the monthly 20SMA and initiate a recovery rally. However, it is unlikely that gold will reach new highs in the coming years. The above information is for reference only and does not constitute investment advice.
2026-06-24
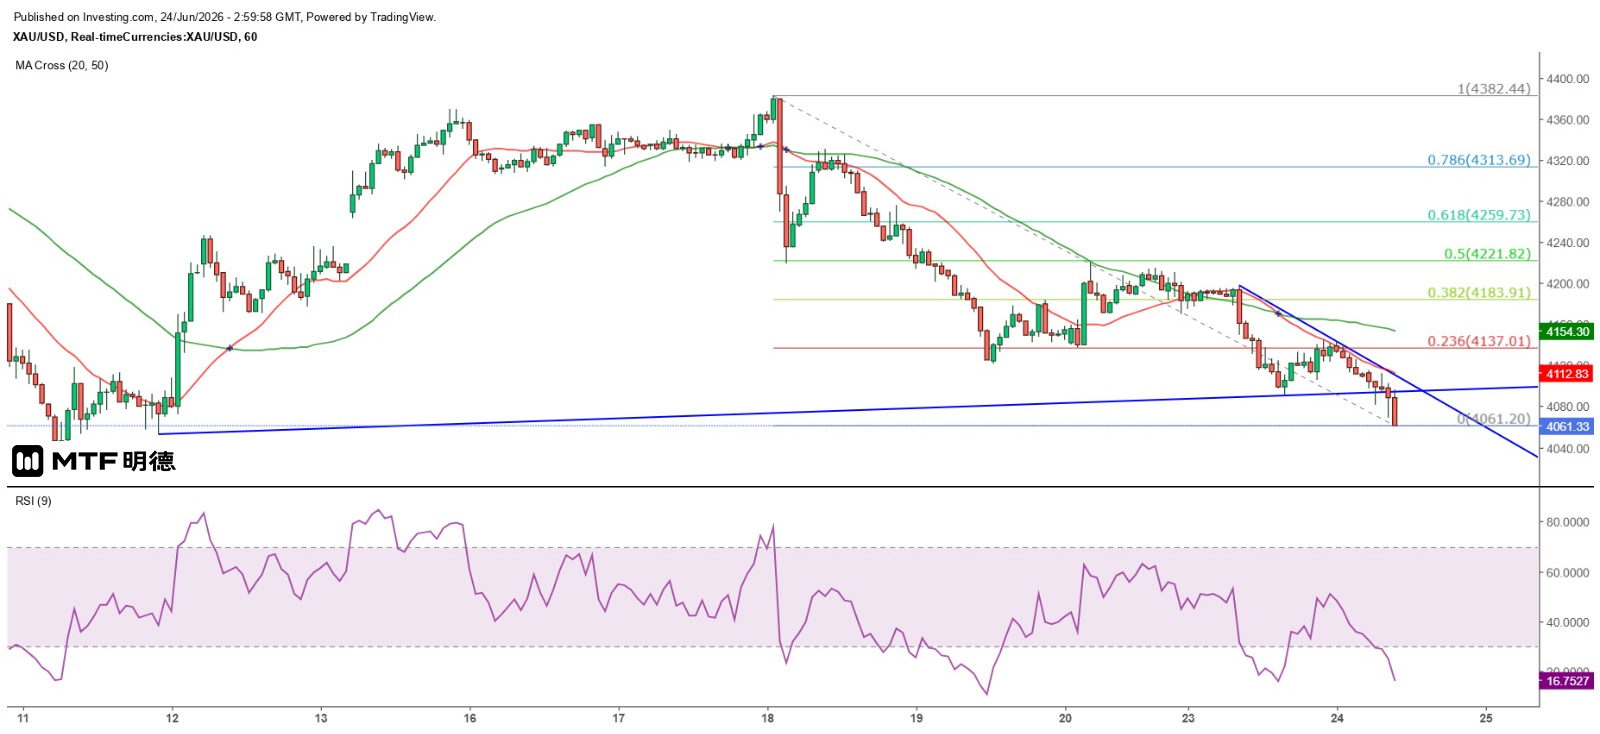
《金价有望呈双底背驰反弹》24/6/2026 10:57 完稿 近日油金价格走势同向,纽约期油已跌至72美元水平,现货金价在昨天纽约市早段高见4144.73美元后反复下跌。油价走弱主要受美伊谈判有进展相关,但有一点对油价将产生极大负面影响的,就是阿曼昨天发布声明指,在遵守国际法和《联合国海洋法公约》、保障海峡自由通行且不收取通行费用的基础上,加上配合美国与伊朗相关谈判所取得的船舶协调,相关航道将按照国际海事组织及阿曼主管机关公布的航行座标运行,计划使用此航道的船舶需事先与国际海事组织进行协调。换言之,运油船可经接近阿曼的水域进出,伊朗若坚持要收费,你认为船公司会选择哪一航道? 从一开始我就说,纽油将会跌返70美元以下。故此,油价与金价的反向关系将会结束,前者可视为通胀之因,后者则为通胀之果,两者走势反向属异常。近日所见,美股三大指数转跌、非美货币兑美元跌破关键心理支持位,而美元兑日圆高见161.93后,日本财务省谓已与美国财政部讨论日圆偏弱的问题,日本单方面干预甚或联合干预行动随时出现,一旦美股大幅下跌,日圆将被市场视为避险货币而走强,同时投资者亦不会相信联储局会在美股大跌的情况下考虑加息,金价亦将受惠而上升。 目前关键点是,金价是否一如预期正在营造大型双底。从日线图观察,现货金价似要下试6月11日的低位4023.96美元,若然跌穿该位,金价将与9RSI形成底背驰,纵未至于即时回升,但亦料会因此而造就严重超卖下的大反弹,尤其4010美元位于江恩90度角,属强力支持位,故暂时判断金价仍可守稳在4000美元以上,日内则以5分钟图50SMA(4089.5)、4090美元及小时图20SMA(4113)为反弹阻力。 以上内容仅供参考,不构成投资建议。
2026-06-23
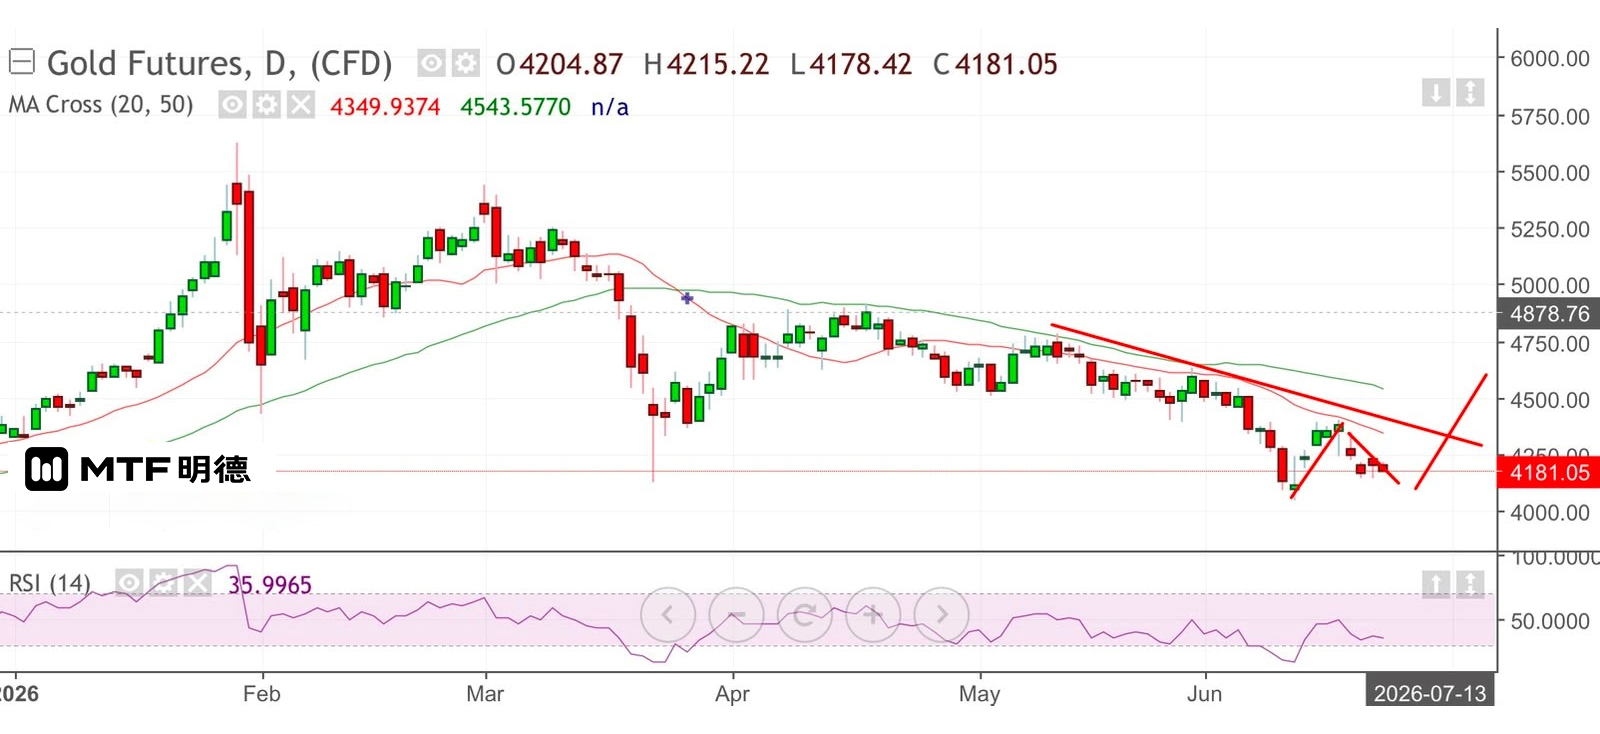
"Gold Price May Be Forming a Double Bottom Pattern" Completed on 23/6/2026 09:36 Negotiations between the U.S. and Iran in Switzerland continue, focusing on ceasefire in Lebanon, nuclear issues, and sanctions relief. However, disagreements persist on certain topics—Iran denies some nuclear commitments, while Trump retains the possibility of attacking Iran again. Meanwhile, shipping through the Strait of Hormuz is gradually resuming, and oil supply is slowly returning to normal. Gold prices remained volatile at higher levels, with spot gold briefly dropping to $4,169 at the close of London trading before gradually recovering. However, in today's early Asian session, it still failed to reclaim the previous high of $4,201 before the sharp decline, peaking only at $4,198. On the hourly chart, gold remains trapped between the 20SMA (currently around $4,194) and the 50SMA (currently around $4,181). From an optimistic standpoint, gold prices and the 20SMA are above the 50SMA, suggesting potential upward breakout after consolidation. The chart pattern shows a slight descending triangle formation, and with the latest PCE data set to be released by the U.S. on Thursday, investors are likely to monitor this release closely to gauge the future direction of U.S. interest rates. Based on the descending pennant pattern on the hourly chart, gold is likely to test 4,160 dollars or even lower during the day. If this level is breached, prices could move toward testing 4,110 and potentially 4,000 dollars. However, from a daily chart perspective, gold appears to be forming a double-bottom pattern, and the possibility of another attempt to challenge 4,382 dollars (temporarily viewed as the neckline of the double bottom) cannot be ruled out. In the short term, however, price movements are expected to remain largely sideways with repeated fluctuations. The above content is for reference only and does not constitute investment advice.
2026-06-22
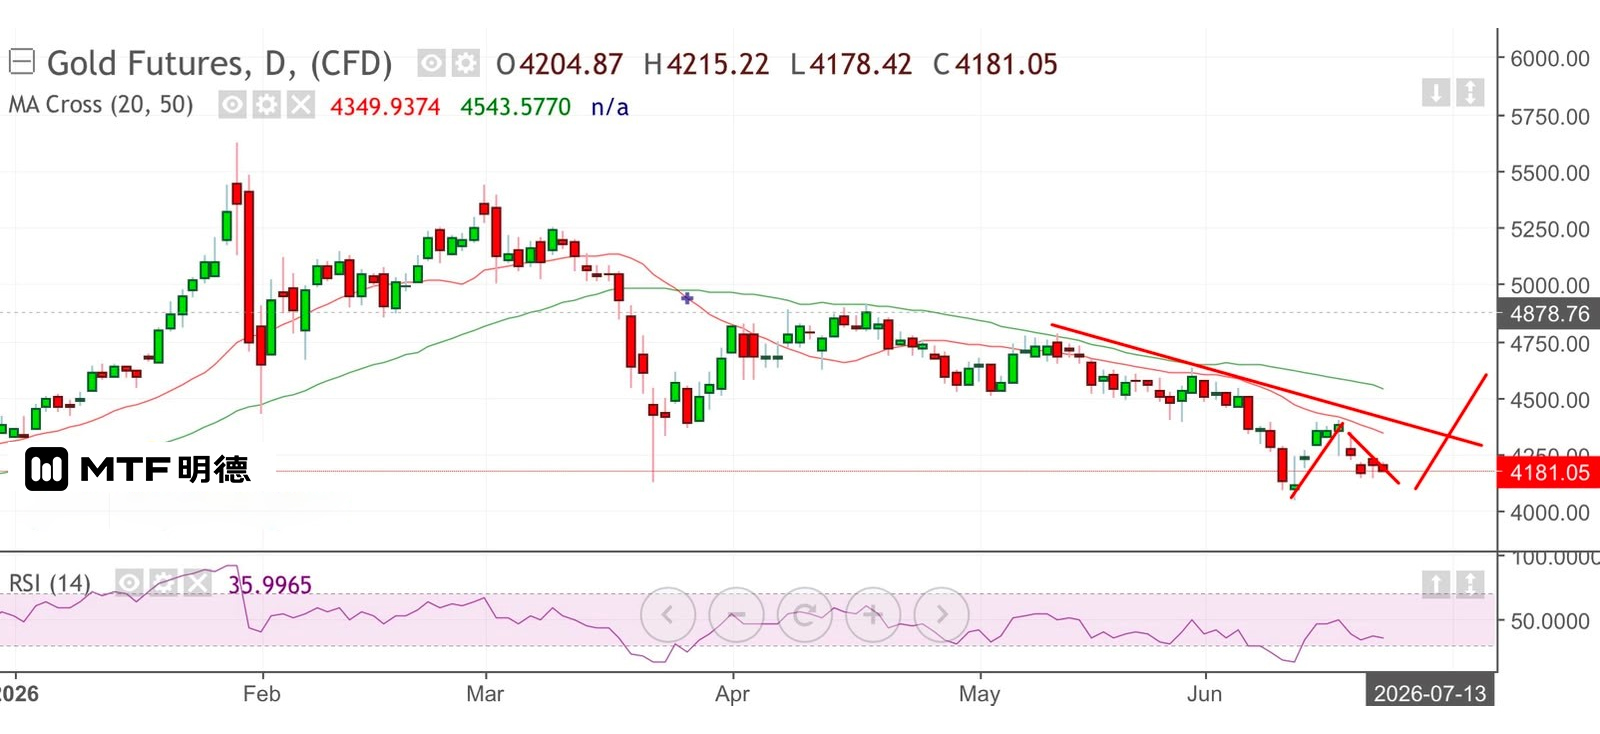
Gold Price Rebound May Create Room for Further Decline – June 22, 2026, 09:23 The United States and Iran have launched peace talks in Switzerland aimed at resolving Iran's nuclear program and permanently reopening the Strait of Hormuz. Meanwhile, U.S. President Trump has once again threatened that the United States will strike Iran if Hezbollah continues its attacks on Israel. The United States and Iran are holding talks in Switzerland on opening the Strait of Hormuz and nuclear issues. U.S. Vice President Vance and Iranian Foreign Minister Abbas, among other officials, attended the discussions. On Sunday, Vance told reporters that significant progress had been made over the past several hours, with more expected in the coming hours. A U.S. diplomat involved in the talks said that the day's discussions covered aspects of the nuclear deal, explored ways to ensure consistency and consensus among all parties, and addressed plans to advance future negotiations at both political and technical levels. However, during the talks, Trump threatened that if Hezbollah continued attacks on Israel, the United States would launch strikes against Iran. Gold prices softened last Friday, partly due to ongoing tensions between the U.S. and Iran, and also under pressure from the Federal Reserve's hawkish stance following its interest rate decision on Thursday. Spot gold briefly fell to $4,121 before gradually recovering. This morning, prices rebounded sharply, primarily driven by progress in U.S.-Iran nuclear talks. Spot gold prices have risen to $4,220. On the hourly chart, gold has broken above the 20SMA (currently around $4,160) and is approaching the 50SMA (currently around $4,221). In the short term, the 20SMA acts as a key intraday support level, with a high probability of breaking through the 50SMA. Currently, prices are constrained by the previous correction low at $4,219, suggesting consolidation followed by an upward breakout. At the start of this week, gold could target $4,310. However, investors should note that the latest PCE data from the U.S. will be released on Thursday. If it signals rising inflation, markets may increasingly expect the Federal Reserve to raise interest rates this year, which would put downward pressure on gold. The current rally might merely be creating room for a future decline, with $4,310 seen as a near-term resistance level. The above content is for reference only and does not constitute investment advice.
2026-06-18
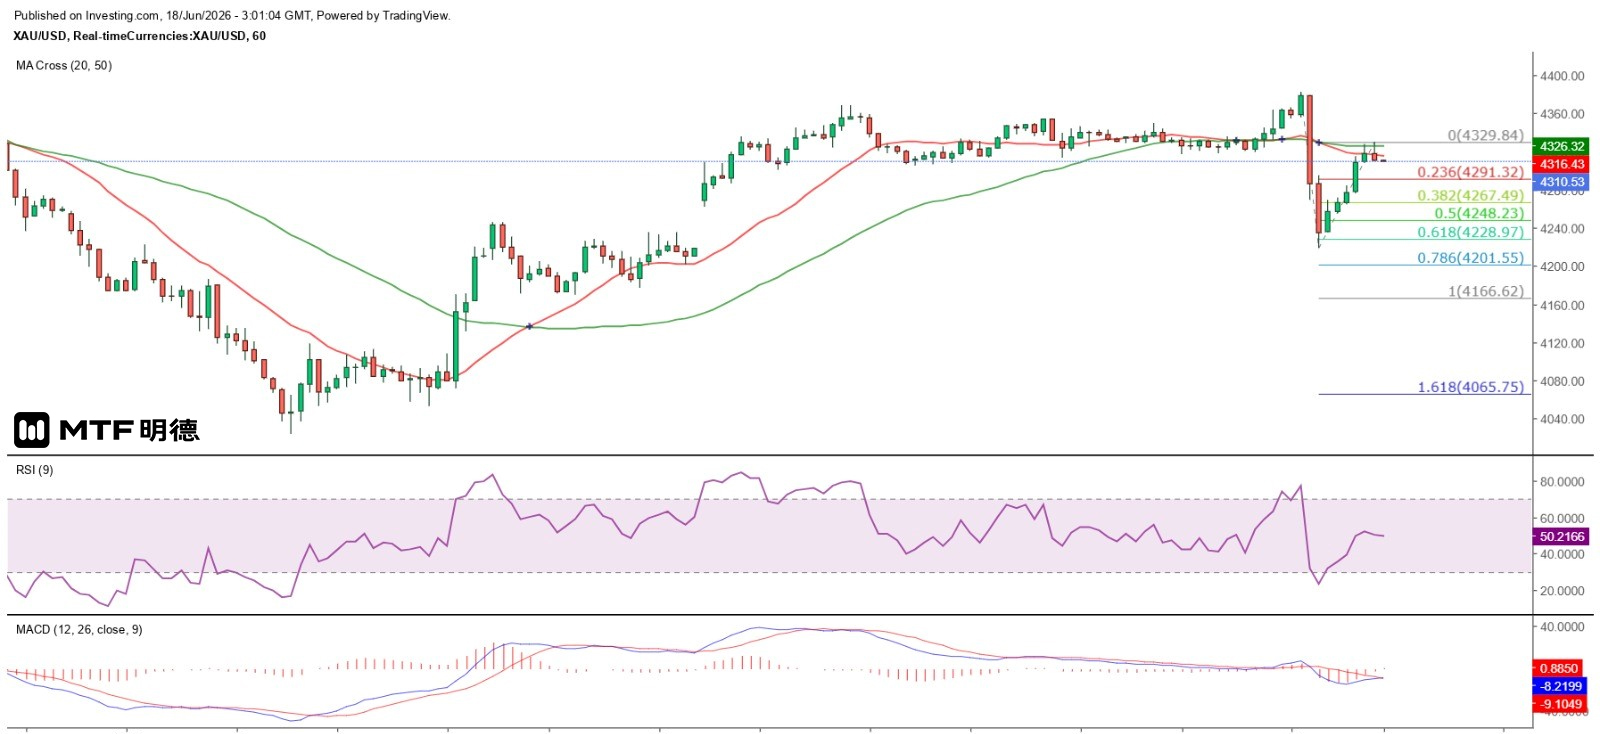
Gold price fails to challenge 4,410 as trend weakens June 18, 2026, 10:56 AM Yesterday, gold prices sharply declined following the Federal Reserve's interest rate decision. Although the central bank maintained rates unchanged as expected during this meeting, the dot plot indicated that committee members anticipate a 25-basis-point rate hike within this year. However, Fed Chair Wash did not provide any forecast regarding future interest rate movements. According to the latest economic forecasts released by officials, Federal Reserve members expect the median federal funds rate to rise to 3.8% this year, and to 3.6% in 2025 and 3.4% in 2028. The core PCE inflation forecast was significantly raised from 2.7% in March to 3.6%, although next year's projection was only slightly adjusted from 2.2% to 2.3%. Additionally, officials anticipate the unemployment rate to be 4.3% this year, down from 4.4% in March, and to remain at 4.3% next year. The growth forecast was slightly lowered from 2.4% to 2.2% this year, while it is expected to stay at 2.3% in 2025. The Fed's hint at a 25-basis-point rate hike this year has become market consensus, yet the three major U.S. stock indices and gold prices sharply declined. I believe the reason lies in the fact that the post-meeting statement was brief and did not convey any dovish signals. Investors received no additional information on interest rates, which naturally increased uncertainty, leaving them to act solely based on the one key message—tending toward a 25-basis-point hike this year. Yesterday, the spot gold price plunged from near $4,380 to $4,219 within two hours, filling Monday's upward gap and wiping out long positions built during the week. It subsequently recovered gradually but encountered resistance near the 50-period SMA on the hourly chart (currently around $4,326). The price failed to challenge $4,410, and also fell short of breaking above the 20-period SMA on the daily chart ($4,399), indicating weakening momentum in the short term. For now, we are measuring the recent move from yesterday’s high in New York using Fibonacci extensions, with the 100% extension level at $4,166.62 serving as the immediate downside target. On the daily chart, gold remains in a sideways consolidation phase, making a test of $4,000 unlikely. However, given the prevailing expectation of higher U.S. interest rates, any upward movement for gold faces significant resistance. The above information is for reference only and does not constitute investment advice.
2026-05-12
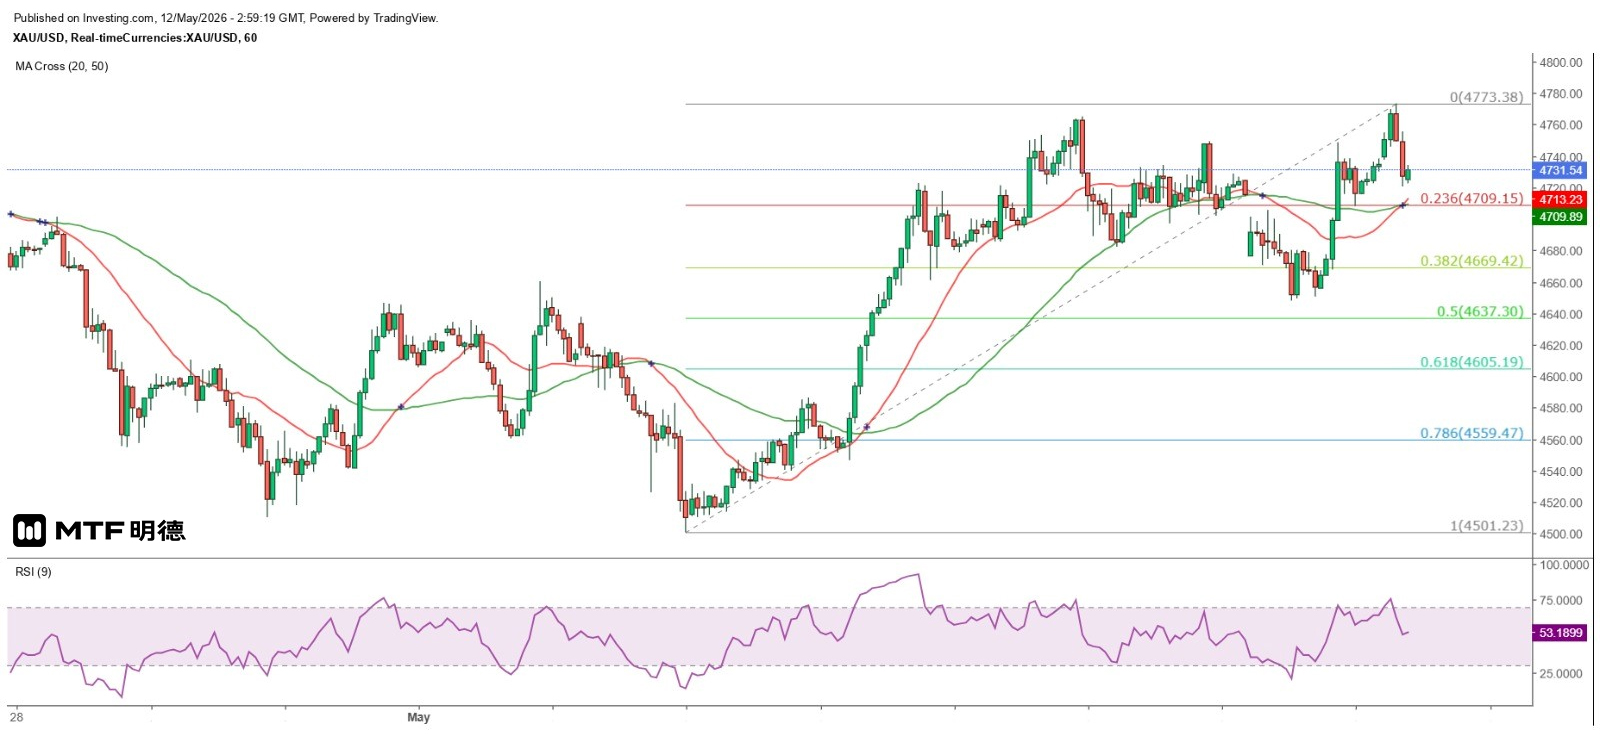
"Gold Price Still Faces Resistance at 50-Day Moving Average" 12/5/2026 10:58 Completed Earlier, Trump expressed extreme dissatisfaction with Iran's response to the 14-point ceasefire proposal put forward by the United States. Subsequently, he threatened to seriously consider taking military action against Iran again. An Iranian official stated that the United States demands that Iran hand over its 60% enriched uranium and opposes transferring it to Russia but to a third country instead. Iran and the United States have serious differences over issues such as the disposal of enriched uranium, the duration of the suspension of uranium enrichment activities, and war reparations. However, the spot gold price quickly rebounded after hitting a low of $4,648.3 in the midday Tokyo session yesterday. It even filled the gap left by the decline in the Asian session in the early New York session, reaching a high of $4,748.46 before consolidating. It closed at $4,708.21 in London and then rose again. This morning in the early Asian session, it once reached a high of $4,773.38, but then dropped sharply to a low of $4,720.51 before stabilizing slightly. From the daily chart, the gold price broke through the 50SMA (currently around 4750) yesterday and closed higher. Today, it continued to rise but encountered strong resistance at that line. However, it's still worth noting that the gold price closed with a bullish candlestick pattern yesterday, indicating a strong upward momentum. But why did the market react so differently this time when Trump threatened to attack Iran again? I can only interpret this as the market taking action earlier than Trump. Investors expect another "TACO" from Trump this time. Whether this is right or wrong, time will tell. However, in terms of technical trends, the 50SMA remains a strong resistance for gold prices. I will still be cautious about the upward trend of gold prices until it closes above this line for three consecutive days. Based on short-term cyclical trends, the short-term top of gold prices may have occurred today. However, if gold prices continue to rise and keep setting new highs in recent days, it is expected to peak on Thursday. From the perspective of Gann theory, the 45-degree angle at 4810 US dollars is regarded as the main short-term resistance for gold prices. After only slightly breaking through the 4660 US dollar level angle yesterday, it was still able to hold above it and launched a strong upward wave, indicating that gold prices are still fluctuating between 4660 and 4810 US dollars. The median of 4735 US dollars may be regarded as the good and bad dividing line for the day! The above content is for reference only and does not constitute investment advice.
2026-05-11
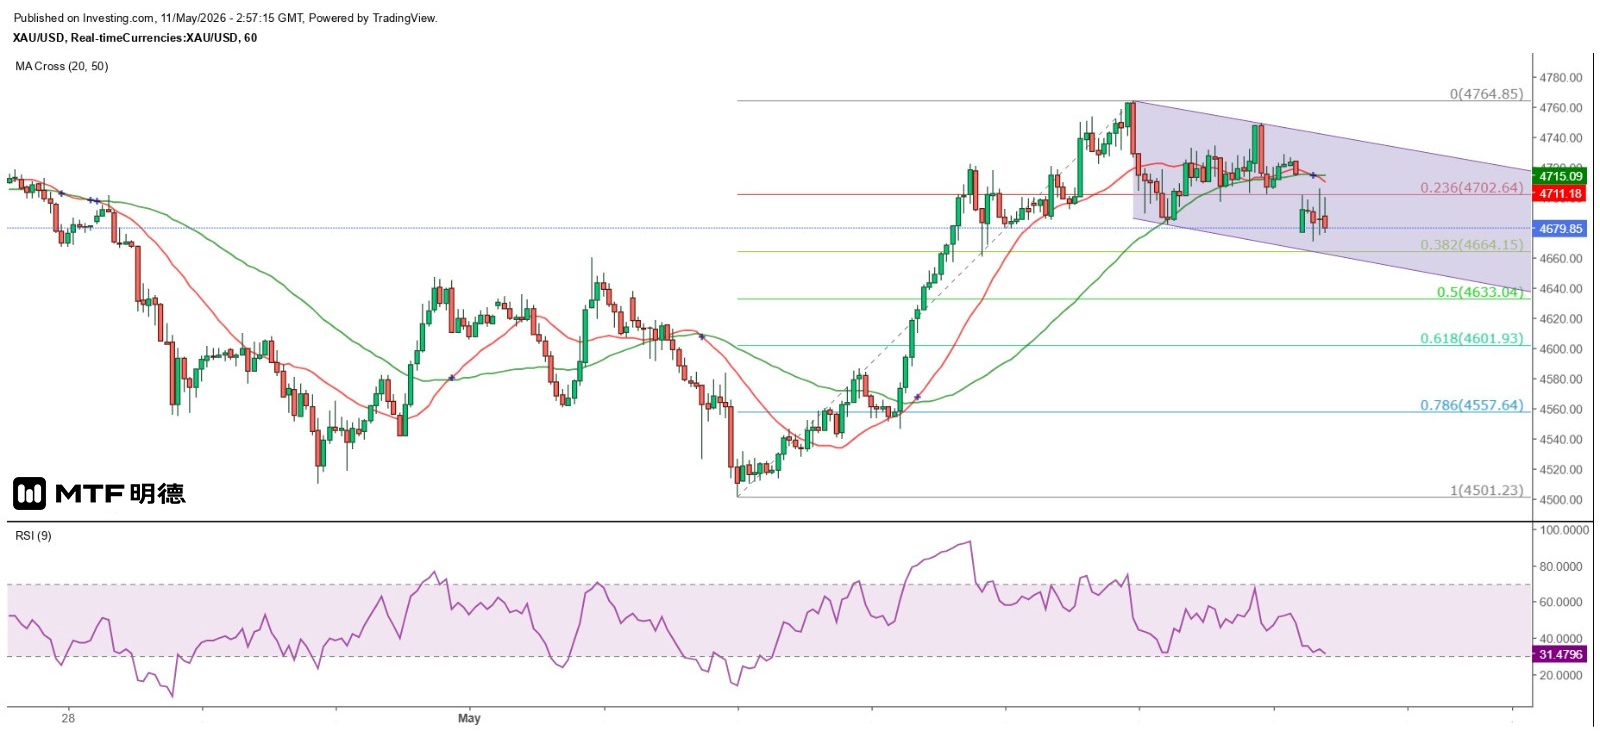
"Gold Price Fluctuates Again in the Short Term" 11/5/2026 10:54 Completed Rather than saying that the US-Iran negotiations have "once again" reached a deadlock, it would be more accurate to say that there has never been any breakthrough in the talks! The positions of both sides are quite clear. The US does not allow Iran to possess nuclear weapons and demands that all highly enriched uranium be transported out of the country. Iran, on the other hand, insists that the strait blockade and long-term sanctions be lifted first, and that compensation be made for the losses caused by the war. It is evident that both sides are holding their ground, resulting in no progress in the negotiations. As a result, oil and gold prices have been fluctuating. Gold prices, as expected, failed to break through the previous high of $4,764.85 after rebounding last Friday. The highest point reached was $4,749.42, and a bearish engulfing pattern emerged on the hourly chart. This morning, it gapped lower at the opening. Although it temporarily stabilized after hitting a low of $4,670.6, it still failed to fill the downward gap. Moreover, the hourly chart shows a pattern of each wave being lower than the previous one. For now, around $4,710 seems to be the intraday resistance level, making a short-term test of $4,660 or even a break below that level highly likely. From the hourly chart, the Gann level of $4,660 remains a key support (or resistance). Gold rebounded to $4,660.15 on May 1 but was then blocked and fell to $4,501.23 on May 1. After that, a strong rebound wave began. On May 6, it broke through this level in the Tokyo midday session and then retraced to $4,660.75 in the early New York session before climbing again. It finally reached a high of $4,764.85 on May 7 before falling again. Based on this, if gold breaks below $4,660 again, a pessimistic estimate is that it will test the $4,500 support level once more. In the meantime, the 50% and 61.8% retracement levels of the maximum increase during the above-mentioned period will be the targets, that is, $4,633.04 and $4,601.93 will be the short-term test levels. Moreover, the 50SMA on the daily chart ($4,755) is a major medium-term resistance for gold. The above content is for reference only and does not constitute investment advice.
2026-05-08
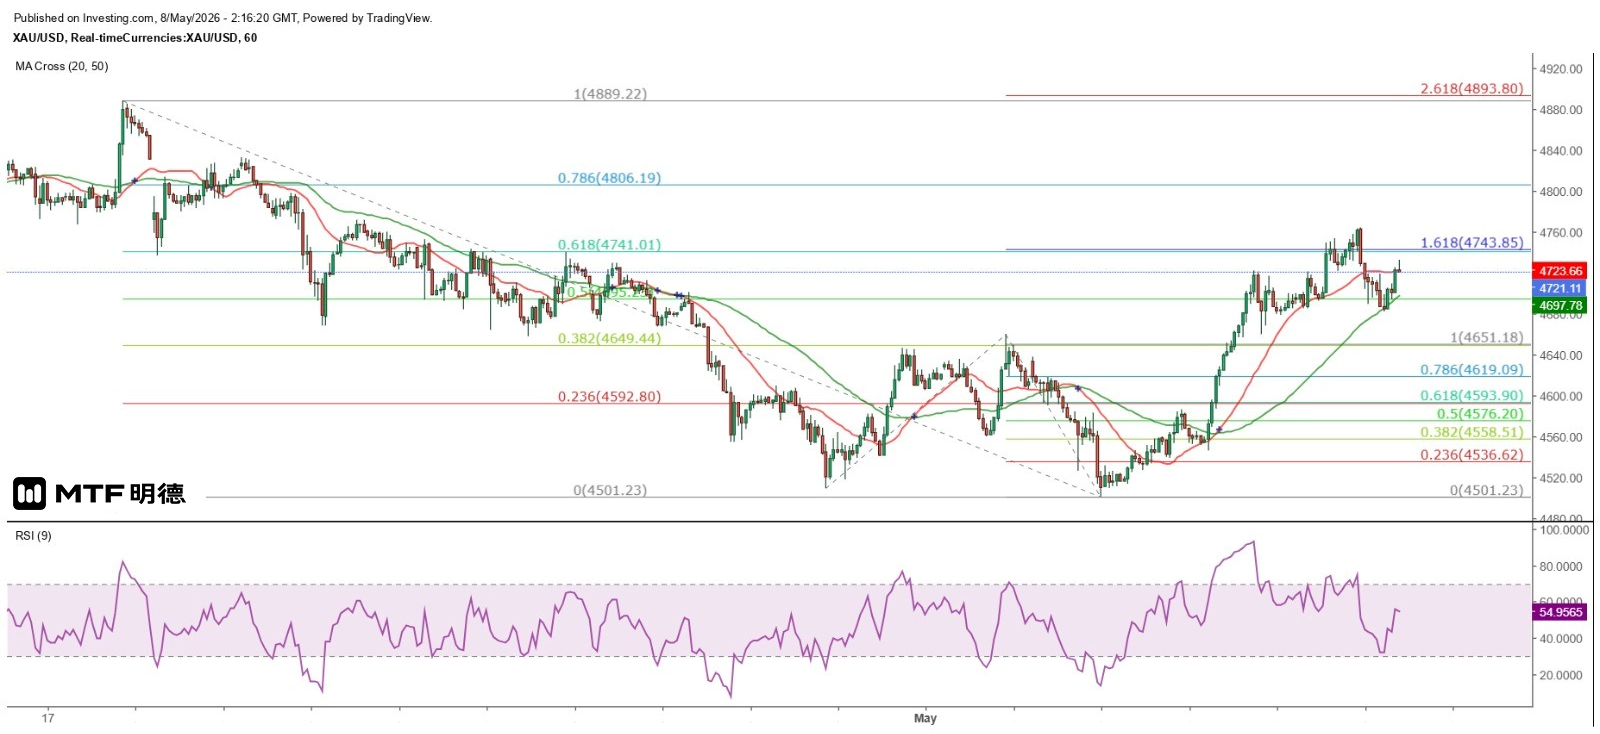
《金价慎防呈双顶回落形态》8/5/2026 10:15 完稿 美国与伊朗的谈判仍在进行,特朗普指进展顺利,或随时达成协议。然另一方面,据CNN报道,伊朗已计划荒通过霍尔木兹海峡的船只制定新规则,无视美国的警告,试图继续推进其对该航道控制权的制度化。该份文件是由伊朗新成立的「波斯湾海峡管理局」(PGSA)发布,内含40多个问题,所有过境船只均须填写。 首先,资料显示,从地理上而言,霍尔木兹海峡北岸属伊朗,但南岸则属阿曼及阿联酋,但在1970年代,伊朗与阿曼扩大领海,令霍尔木兹海峡主要由两国管理,而伊朗在海峡内控制了数个岛屿及驻军,令其有实际军事影响力。 然而,根据国际法,霍尔木兹海峡是连结波斯湾与印度洋的唯一水道,通过该海峡的船只享有「过境通行权」,但伊朗认为其作为沿岸国拥有主权控制权,故若伊朗强行制定法则,并攻击没有何其申请通行霍尔木兹海峡的船只,就很大可能受到国际制裁,甚至遭到美国及其盟友的军事攻击。目前则视乎美伊谈判的进展及其最终结果,风险仍在。 金价持攀升,现货金价在昨天伦敦收市前高见4764.85美元,其后在小时图呈穿头破脚形态下跌,在今天亚洲市早段低见4682美元,略为试穿50SMA(现约4695)后逐步反弹,并升破了20SMA(现约4723),日内有望挑战昨天的高位。然要留意,日线图50SMA目前位于4769美元,除非金价连续三个交易日收高于该位,否则,预期金价在该位附近将再次遇到阻力,令金价向下调整,如此,即使金价日内有望升至4765或以上,其极有可能与前顶形成双顶形态回落,届时以4660美元为下跌目标,故不宜对短期金价的升势太过乐观。 以上内容仅供参考,不构成投资建议。
2026-05-07
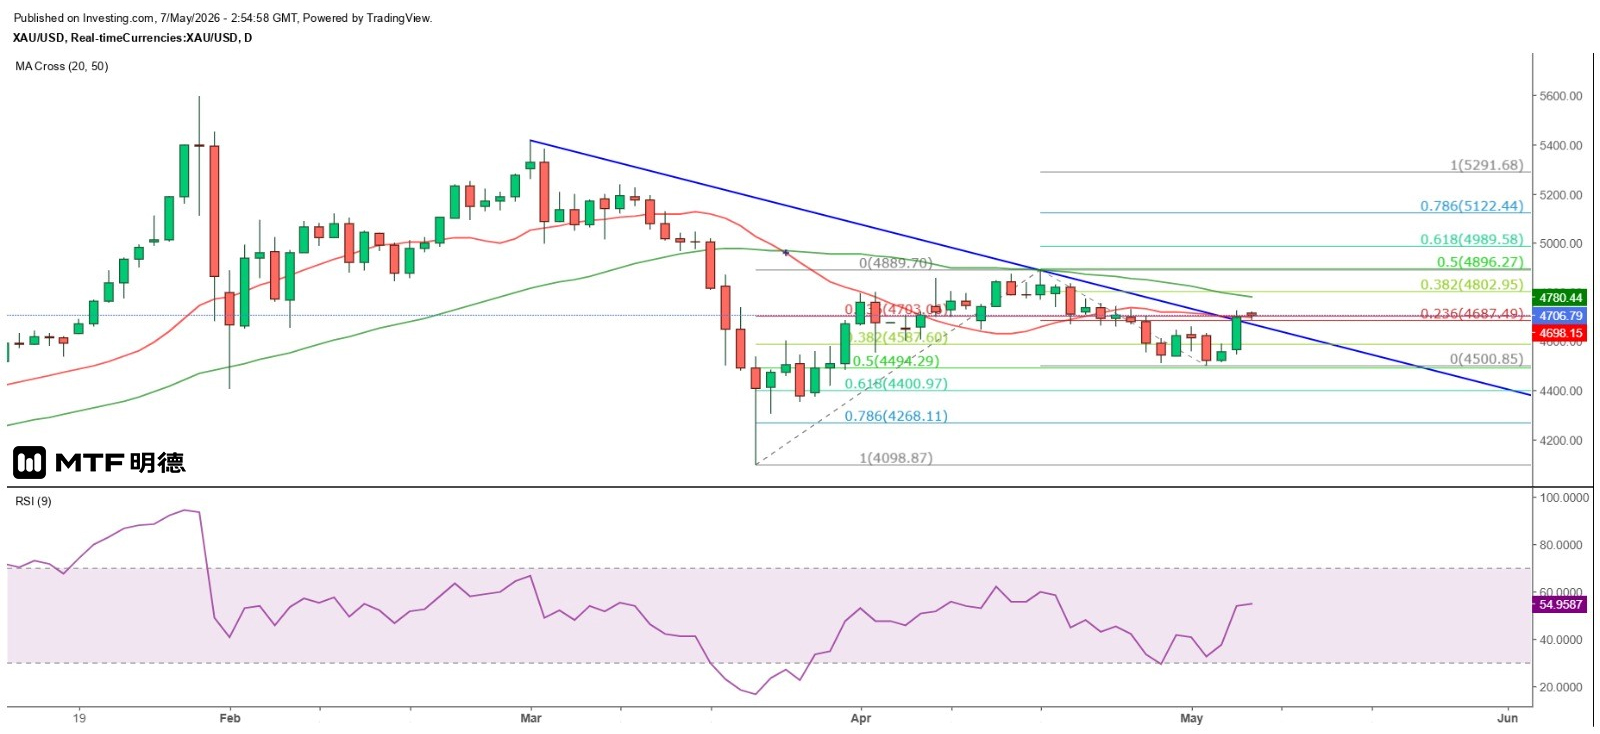
"Gold Price Holds at $4,700, Continues to Test Higher Levels" 7/5/2026 10:53 Finalized The market is increasingly optimistic about the possibility of the US and Iran reaching a so-called "final agreement", causing oil prices to continue to fall while gold prices have further rebounded. According to CNN, citing sources, Iran is expected to submit its response to the US' proposed final agreement to mediators today, and it is said that both sides are making efforts to reach an agreement. In fact, when investors conduct analysis, the ultimate outcome of some extreme situations is like the line in Jacky Cheung's song "Interlude of Life" - "From the beginning it has ended." The ultimate outcome of the war between the US and Iran is either the fall of the Islamic theocracy or reaching an agreement with the US. The result of the sharp rise in oil prices due to the war is bound to return to its original state! If you know from the very beginning that the upward trend of oil prices cannot be sustained, the direction of operation is already very clear. The key lies in risk management. Spot gold prices rose by more than 166 dollars yesterday, not only breaking through 4700 dollars but also surpassing the resistance of the daily chart's downtrend line. Currently, it is consolidating above the 20SMA (4697.8) on the daily chart. From the perspective of Gann's Square, it is estimated that 4660 dollars will again become a strong support level. Therefore, the market is likely to fluctuate above 4660 dollars in the future. In the short term, it is expected to further challenge the 50SMA (4780), and 4810 dollars is expected to be the next resistance level to be challenged. Theoretically, 4700 dollars will become an important support level for the day. Although silver has been neglected recently, its price still rose by as much as 5 dollars yesterday. From the daily chart, the price of silver has approached the lower trend line. Even though it has now broken through the lower trend line, it is highly likely to be a false breakout. There is a greater chance of a pullback, and for the time being, 70.85 dollars is seen as support. As for oil prices, they are in a triangular formation on the daily chart. It is expected that 80 dollars will be tested again, and this level can be regarded as a key support. If it is breached, 70 dollars will also be hard to hold back the decline in oil prices. I still believe that oil prices will have to fall back to 65 dollars to find support. The above content is for reference only and does not constitute investment advice.
2026-05-06
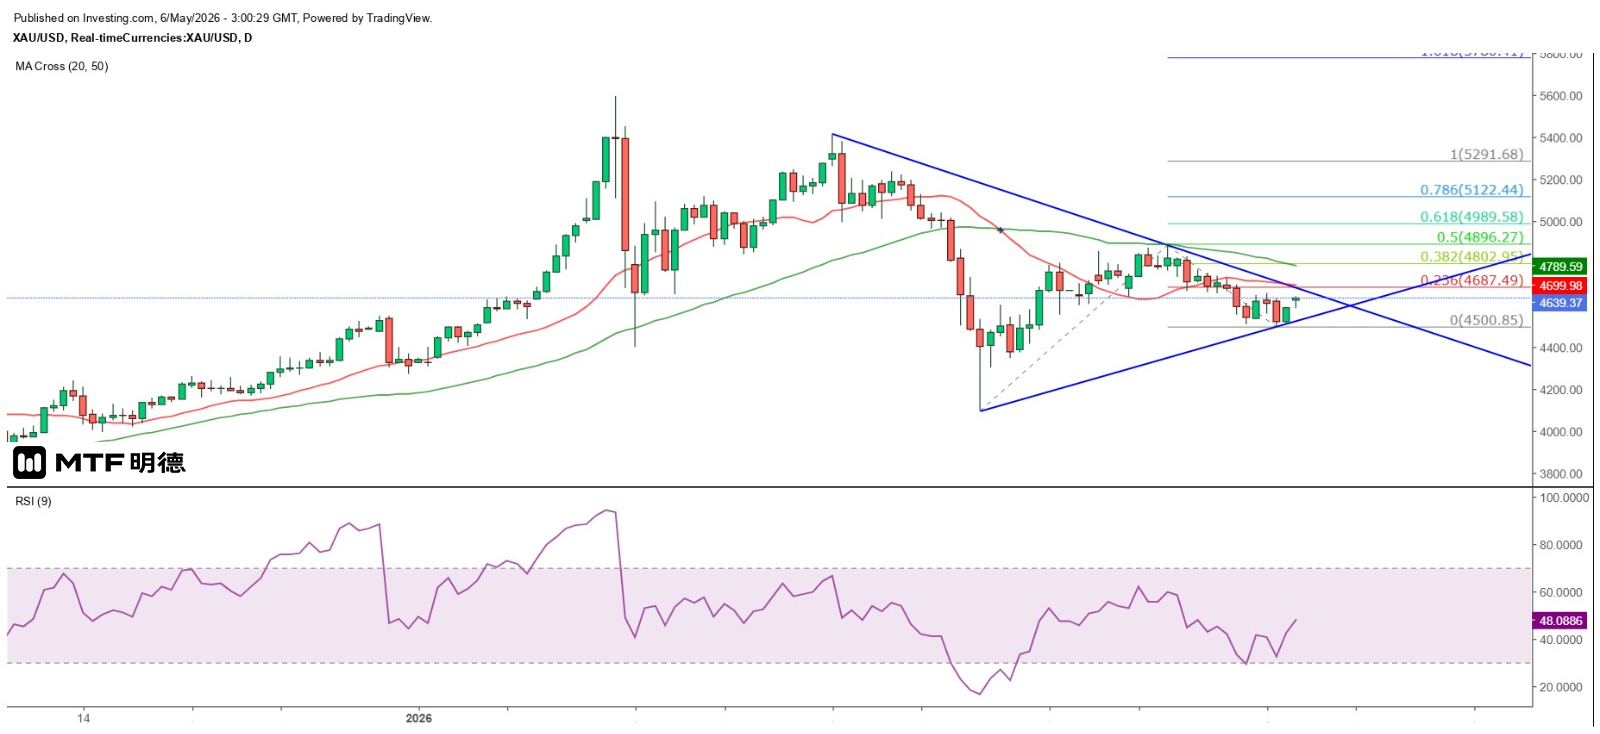
"Gold Price Continues to Test Highs in the Short Term" 6/5/2026 10:59 Completed Trump's policy towards Iran has been inconsistent, causing continuous fluctuations in the financial market. The "Freedom Operation" plan, which was implemented for less than 24 hours, was announced to be over. However, it is believed that this was due to the expiration of the 60-day period for US military operations abroad without congressional authorization. Nevertheless, if the US and Iran can still reach a nuclear agreement in the coming period, will the US military launch another attack on Iran? In any case, the brief cessation of confrontation has given the financial market some breathing room. Gold prices have continued to rise as expected. The spot gold price has already broken through the $4,600 mark this morning, with the current high at $4,636.13. Whether it can break through the 38.2% retracement level of the biggest decline since April 17, which is $4,649.44, is crucial. On April 30, the price approached this level but failed to break through. The next day, it dropped to around $4,560. It then challenged this level again, breaking through briefly but failing to hold above it. Now, it is launching another attack. It is estimated that it can smoothly break through this level and challenge the strong resistance at the Gann Square level of $4,660. Subsequently, it can aim for the 50% and 61.8% retracement levels of the aforementioned biggest decline, which are $4,695.23 and $4,741.01 respectively. From the daily chart, the low of $4,500.85 that gold made on Monday is very close to the 50% retracement level of the biggest rise since March 23, which is $4,494.29. After stabilizing and rebounding, it indicates that gold is likely to resume its upward trend. Measured by the Fibonacci extension, if the amplitude reaches 50%, the gold price could reach $4,896.27, and if it reaches 61.8%, it could reach $4,989.58. Whether a double top will be formed near the previous peak of $4,889.7 remains to be seen. In the short term, if the price continues to rise, $4,660 will still be a key resistance level. If it breaks through, the 20SMA ($4,657) and 50SMA ($4,892) will be the main technical resistance. The above content is for reference only and does not constitute investment advice.
2026-05-05
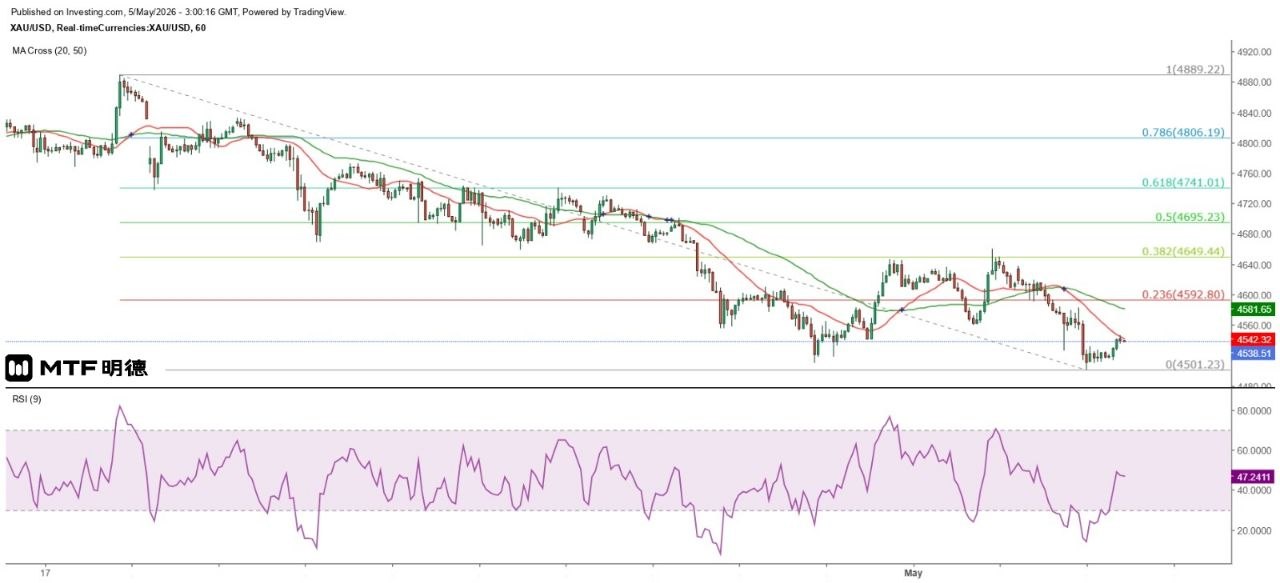
"Gold Prices Show a Short-Term Double-Bottom Rebound Pattern" 5/5/2026 10:59 Completed The situation between the US and Iran has heated up again, causing oil prices to surge and gold prices to fall. Iran's proposed 14-point "final settlement plan" includes the withdrawal of US troops from the Middle East, the lifting of the blockade, the unfreezing of assets, compensation for Iran's losses caused by the war, and the lifting of sanctions. However, after reviewing it, Trump found it unacceptable, claiming that the plan did not address the nuclear issue. Recently, there have been sporadic skirmishes between the two sides. The US claimed to have sunk an Iranian speedboat, while Iran said it hit a US warship. The United Arab Emirates also claimed to have been attacked by Iranian drones and missiles. The US-Iran negotiations remain at an impasse, and the supply of crude oil is once again affected, pushing up oil prices. The risk aversion sentiment is on the rise, and inflation expectations remain high. The difficulty in lowering interest rates has hit gold prices. Yesterday, the spot gold price in London closed at a low of $4,501.23, but then continued to rise. This morning, it reached a high of $4,546.77. The trend of New York crude oil was more volatile. It rose to $107.46 in the European midday session, but then dropped sharply to $101.49, lower than the pre-rally low of $102.75. Although it climbed again later, it failed to break the peak. After several attempts to reach $107 failed, it dropped again. This morning, it bottomed out at $103.95 before stabilizing. Looking at the spot gold price's movement from the hourly chart, after falling to the edge of $4,500 yesterday, the 9RSI has dropped to the extremely oversold level of 14, thus creating a rebound. It is highly likely to form a double bottom with the low point on April 29th. Currently, the gold price is encountering resistance at the 20SMA ($4,545). As the gold price did not maintain the upward trend as mentioned yesterday, the prediction of peaking and falling back on Thursday this week is no longer valid. However, based on the cyclical trend, the gold price is expected to bottom out and rebound today, and is likely to fluctuate upward for the rest of the week. $4,660 is regarded as the main short-term resistance, and a breakthrough above this level may once again challenge $4,810. $4,500 is expected to serve as the short-term support. The above content is for reference only and does not constitute investment advice.
2026-05-04
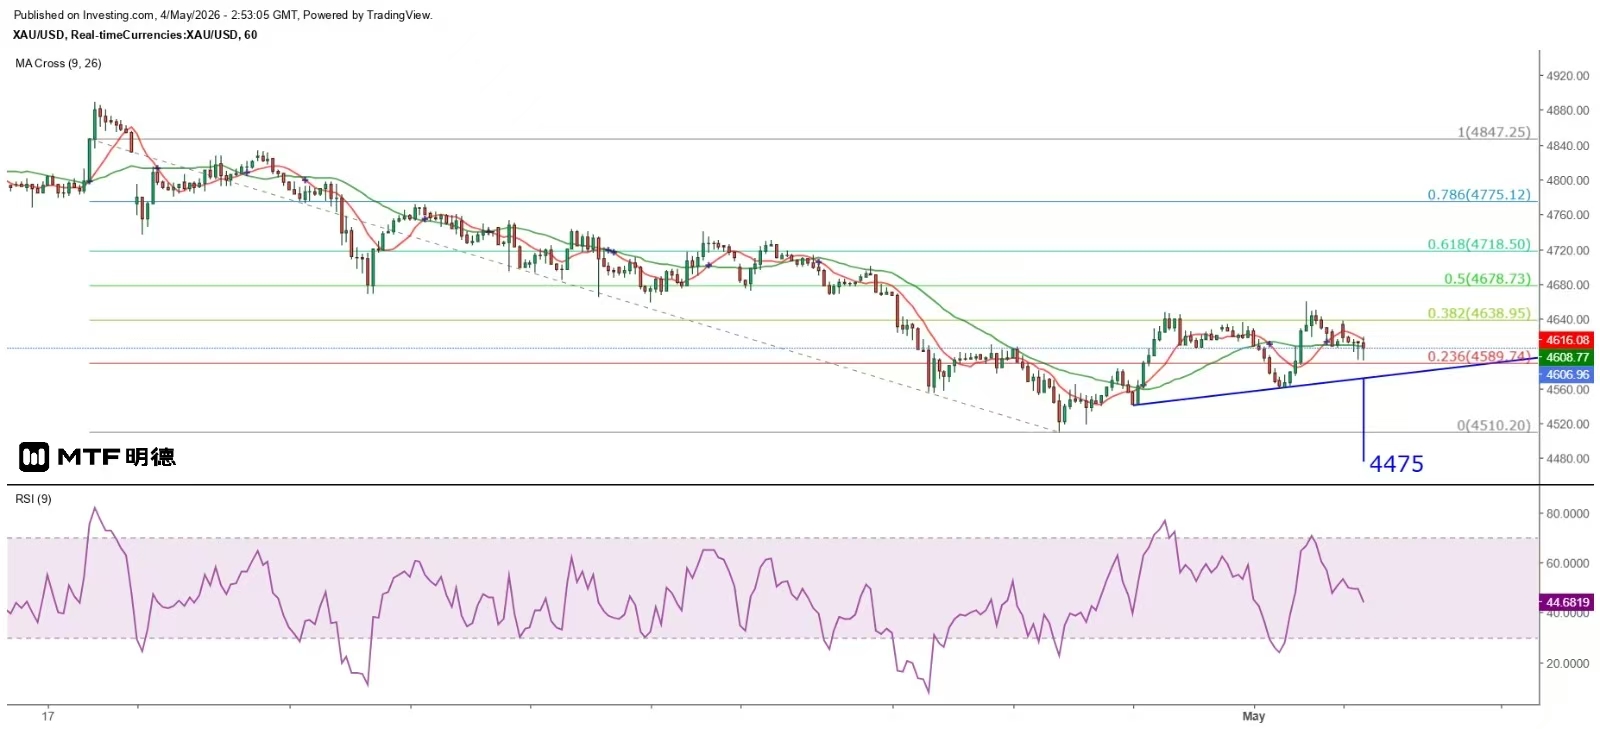
Gold Price Expected to Hit Top and Fall Back on Thursday "4/5/2026 10:49 Completed Since the development of the US Iran situation, I increasingly feel that Iran has fallen into the trap set by Trump! Trump said that the United States will make every effort to ensure that other countries not involved in this incident can safely pass their ships through the Strait of Hormuz, and named the relevant operation "Operation Freedom". Starting this morning Middle East time, the US military will deploy missile destroyers, more than 100 land and sea aircraft, multi domain unmanned operating systems, and 15000 officers and soldiers to participate in the relevant operation. However, Trump emphasized that only ships from countries that are not involved in the relevant events are protected. In other words, merchant ships related to Iran naturally cannot pass through this channel, and some European countries such as Spain that did not provide assistance to the United States during the military conflict between the United States and Iran may also not allow their merchant ships to pass through. In fact, since the outbreak of the incident, Iran has ultimately had to accept the US nuclear agreement plan, otherwise it will face further military strikes. Affected by the news, June oil in New York fell as low as $99.11 this morning, but gradually regained lost ground and rose to a high of $102.33, filling the gap in the decline. However, it then fell again and temporarily hovered below $102. I believe that CNOOC will eventually return below $70 if Iran compromises, does that mean a significant increase in gold prices? Not necessarily, the significant drop in oil prices will quickly alleviate concerns about the overall price increase caused by oil prices. At that time, the market focus will return to the monetary policy of central banks around the world, especially the Federal Reserve in the United States. The US Department of Labor will release its non farm payroll report for April this Friday. Currently, the market expects an overall increase of only 73000 non farm jobs, with the unemployment rate remaining at 6.7%. Private enterprises alone are expected to add 60000 jobs. Such numbers can serve as an excuse for the rise in gold prices. However, SPDR holdings have been continuously decreasing since March this year, reaching 1101.33 tons on March 2nd and continuing to decline. They have now decreased to 1035.77 tons last Friday, reflecting that investors have begun to take advantage of the high prices to profit. The gold price rose to $4660 as expected last Friday but was hindered from falling back, and this morning it even fell below $4600. Due to the largest rebound in gold prices since April 29th, which was less than 50% of the largest decline since April 17th, it reflects a weak short-term rebound in gold prices, and there is a greater chance of testing $4510 in the future market. Measured by the TD line on the hourly chart, once the gold price falls below the TD uptrend, the downward target is approximately $4475. In addition, if the gold price maintains its current upward trend, it is expected to peak and fall back this Thursday, approaching $4660, which should be seen as a selling opportunity. The above content is for reference only and does not constitute investment advice.
2026-04-30
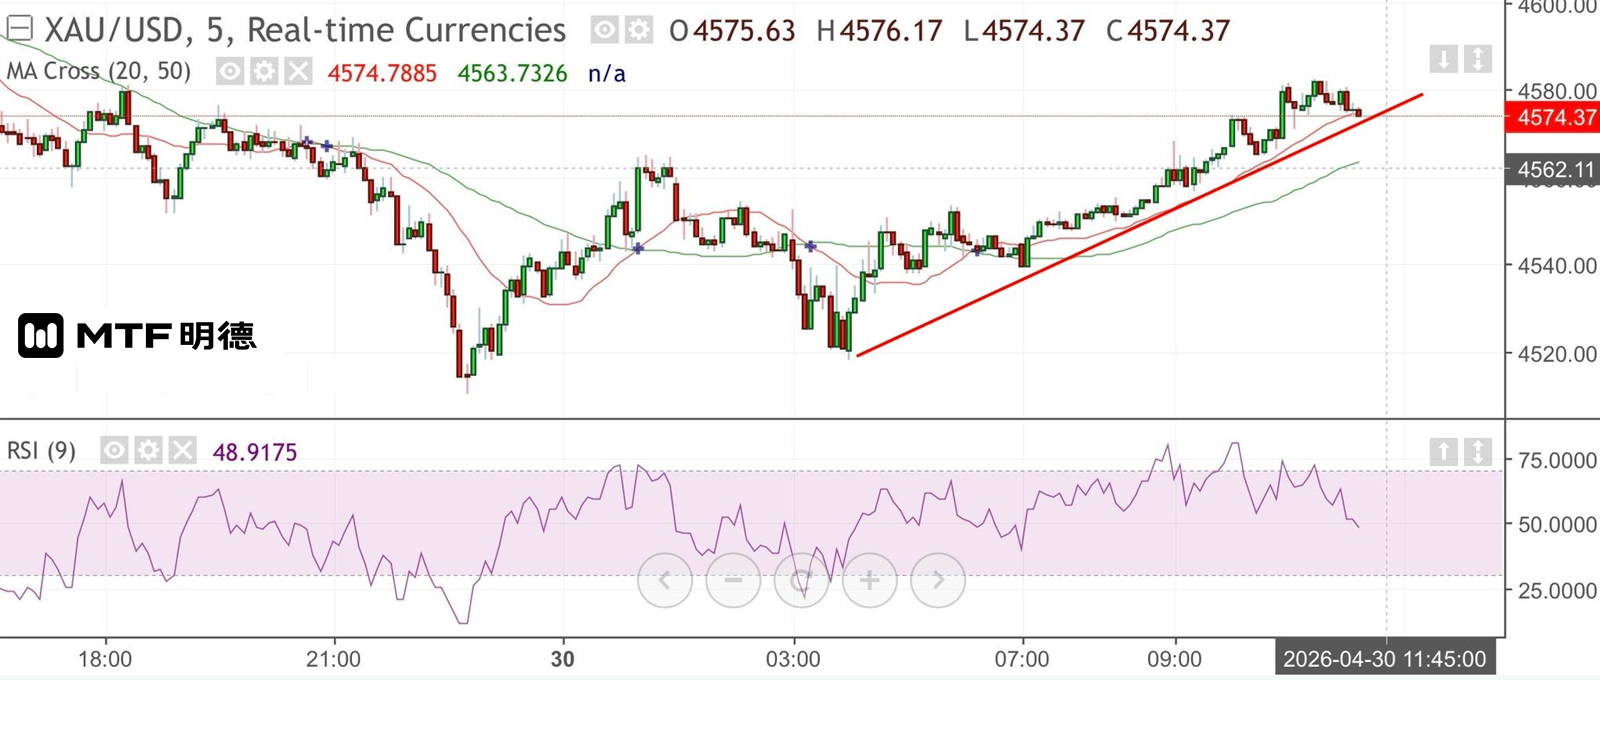
"Gold Prices Remain in Short-Term Volatile Range" 30/4/2026 10:19 Completed Yesterday, oil prices remained in a high-range fluctuation. Although supported by geopolitical risks, the news of the UAE's withdrawal from OPEC+ brought some profit-taking pressure. However, market concerns over crude oil supply still pushed oil prices upward. New York crude oil rose to $111 yesterday and further climbed to $111.27 this morning before encountering some selling pressure. For oil prices to experience a significant decline, the United States and Iran must reach a nuclear agreement to ease their tense relations. At that time, the market will refocus on the influence of oil-producing countries and the global economic performance, and judge the oil price trend based on the fundamentals. Spot gold prices have continued to fall after breaking below the 20-day simple moving average on the daily chart (currently around 4,717.5). Yesterday, the Federal Reserve, with a 8-4 vote, decided to keep the benchmark interest rate at 3.5% to 3.75%. On the one hand, the Fed believes that the U.S. economy is expanding steadily, but job growth has slowed. Inflationary pressures have risen due to higher energy prices, and the committee remains cautious about progress towards the 2% long-term inflation target. Additionally, the authorities note that economic outlook uncertainty has significantly increased, with the main risk factors being the conflict in the Middle East and supply chain disruptions. Yesterday, the spot gold price once dropped to as low as $4,510.31, but then gradually regained lost ground. This morning, the temporary high was $4,582.56. From the hourly chart, it can be seen that the rebound strength of the gold price is getting stronger and stronger. It has now risen sharply above the 20SMA (currently around $4,556) and is approaching the 50SMA ($4,591). It is expected to rise above $4,600 within the day. However, the $4,660 level at the Gann angle has changed from support to resistance. It is difficult for the gold price to hold this level in the short term. It is expected to fluctuate between $4,500 and $4,660 in the short term. The above content is for reference only and does not constitute investment advice.
2026-04-29
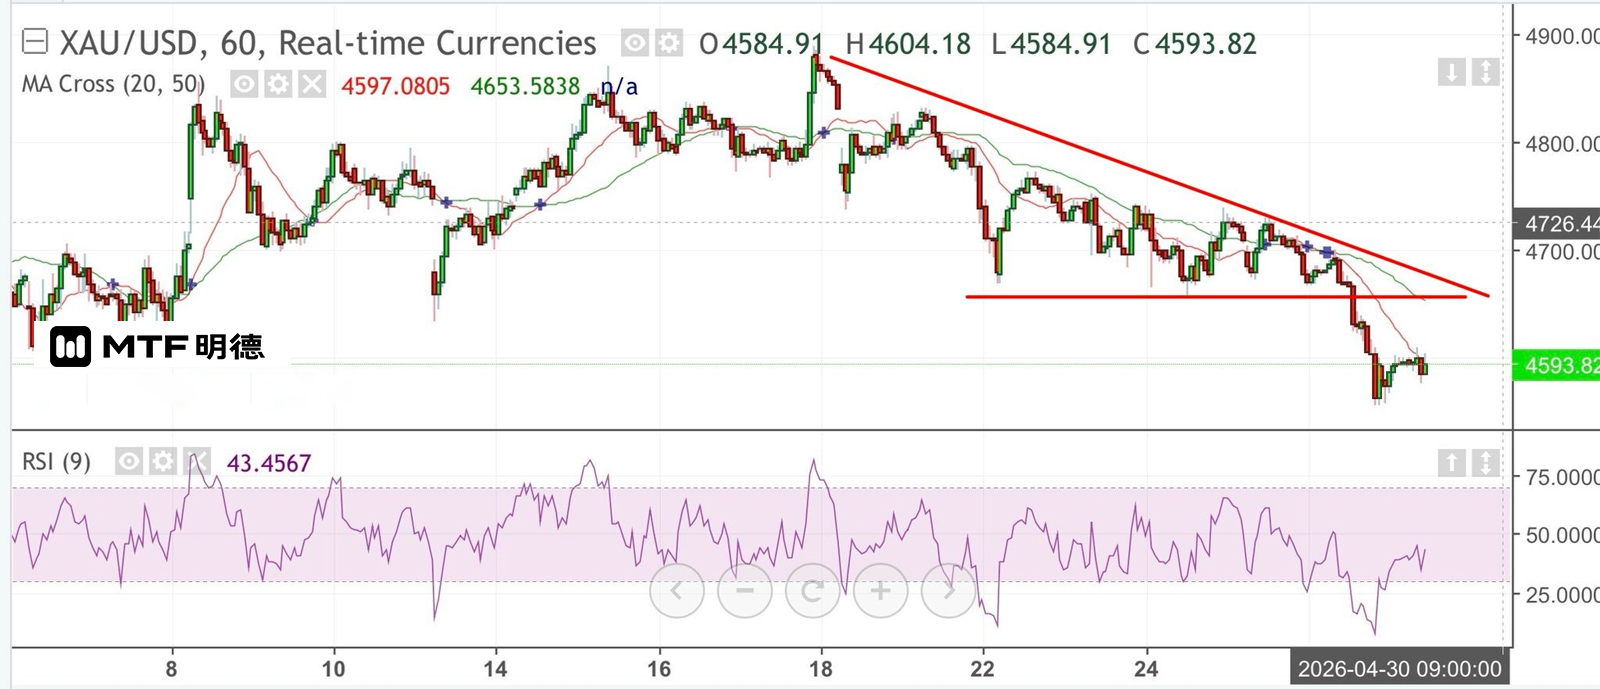
Gold price short-term rebound resistance at $4,650. 29/4/2026 10:47 Completed Yesterday, the United Arab Emirates (UAE) announced its withdrawal from the Organization of the Petroleum Exporting Countries (OPEC) and OPEC+ starting from May 1 this year, ending its nearly 60-year membership. This move is seen as a major blow to OPEC, especially in the context of the Iran war causing disruptions to energy supplies in the Middle East. However, UAE Energy Minister Suhail Mohamed al-Mazrouei stated that this decision is based on the country's long-term strategy and economic vision, and is not an unexpected event. In fact, the UAE's withdrawal from OPEC is due to its production capacity being restricted, but not all members strictly adhere to the production capacity agreement, which has damaged its interests. The UAE has a huge potential for oil production, with its current capacity at about 4.8 million barrels per day and expected to reach 5 million barrels per day next year. However, the OPEC+ quota has long restricted its actual output to 3.4 million barrels per day. After leaving OPEC+, the UAE will have greater flexibility to adjust supply according to market demand. The international oil price initially rose and then fell in response to the news. The New York oil price reached a high of $103.24 in the early Asian market this morning, but then turned downward, and the current price is $100.94. Apparently, the market initially bet on the wrong side, mistakenly believing that the UAE's withdrawal from OPEC+ would reduce the organization's production capacity. In fact, the UAE is pursuing greater production capacity, causing the oil price to turn from rising to falling. The inverse relationship between oil and gold has a greater impact on the gold price. The spot gold price broke through the support level of $4,650 of the flat downward triangle yesterday and dropped to $4,554 before rebounding. This morning in the early Asian session, it was seen at $4,610.34, but it was temporarily constrained by the 20SMA on the hourly chart (currently around $4,597.22). However, the decision of the United Arab Emirates to stabilize oil prices in the long term rather than stimulate a continuous rise in oil prices is expected to have a short-term negative impact on the gold price. The spot gold price is expected to form a double bottom near $4,555 in the short term, but the bottom of the flat downward triangle at around $4,650 will become a resistance for the rebound. The above content is for reference only and does not constitute investment advice.
2026-04-28
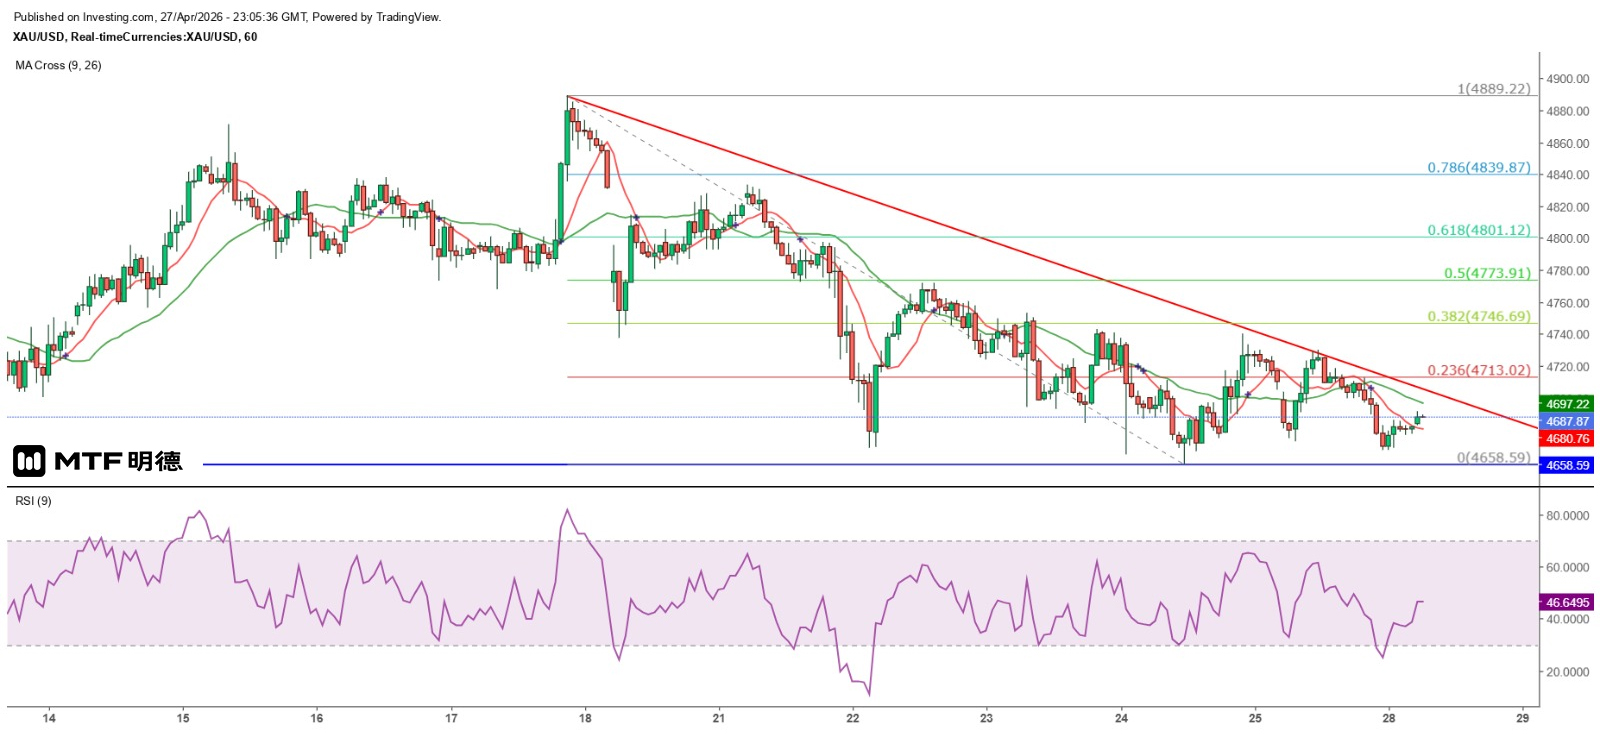
"Gold's Inflation-Resisting Capacity to Be Tested" 28/4/2026 7:04 Completed The situation between the US and Iran remains uncertain. Gold has repeatedly tested the $4,650 level in recent days and has found support. It dropped to $4,667.38 in the late London session last night and rebounded slightly. This morning in the Asian session, it rose to $4,691.24. From the hourly chart, it can be seen that the spot gold price has been continuously falling since it gapped lower last Monday and has formed a flat-bottomed descending triangle. $4,750 seems to be the main resistance in the short term. Gold must break through this level to have the potential to rise further, but $4,810 remains the main resistance. This week, several central banks will announce their interest rate decisions. Due to the unclear situation in the Middle East and the fact that the main oil shipping lane through the Strait of Hormuz is still blocked by Iran and the United States, central banks are expected to maintain a hawkish monetary policy stance, and the possibility of short-term interest rate cuts is slim. If central banks, especially the Federal Reserve, hint at or even suggest the possibility of raising interest rates, gold prices may take the opportunity to test the $4,600 level. As seen from the daily chart, the gold price is currently between the 20SMA (4752) and the 50SMA (4673), and the overall trend remains in a downtrend. Once the Gann level angle at $4,660 is breached, this level will become resistance, and the next test target will be $4,610. At that time, it will be possible to observe whether gold truly has the ability to resist inflation! The above content is for reference only and does not constitute investment advice.
2026-04-27
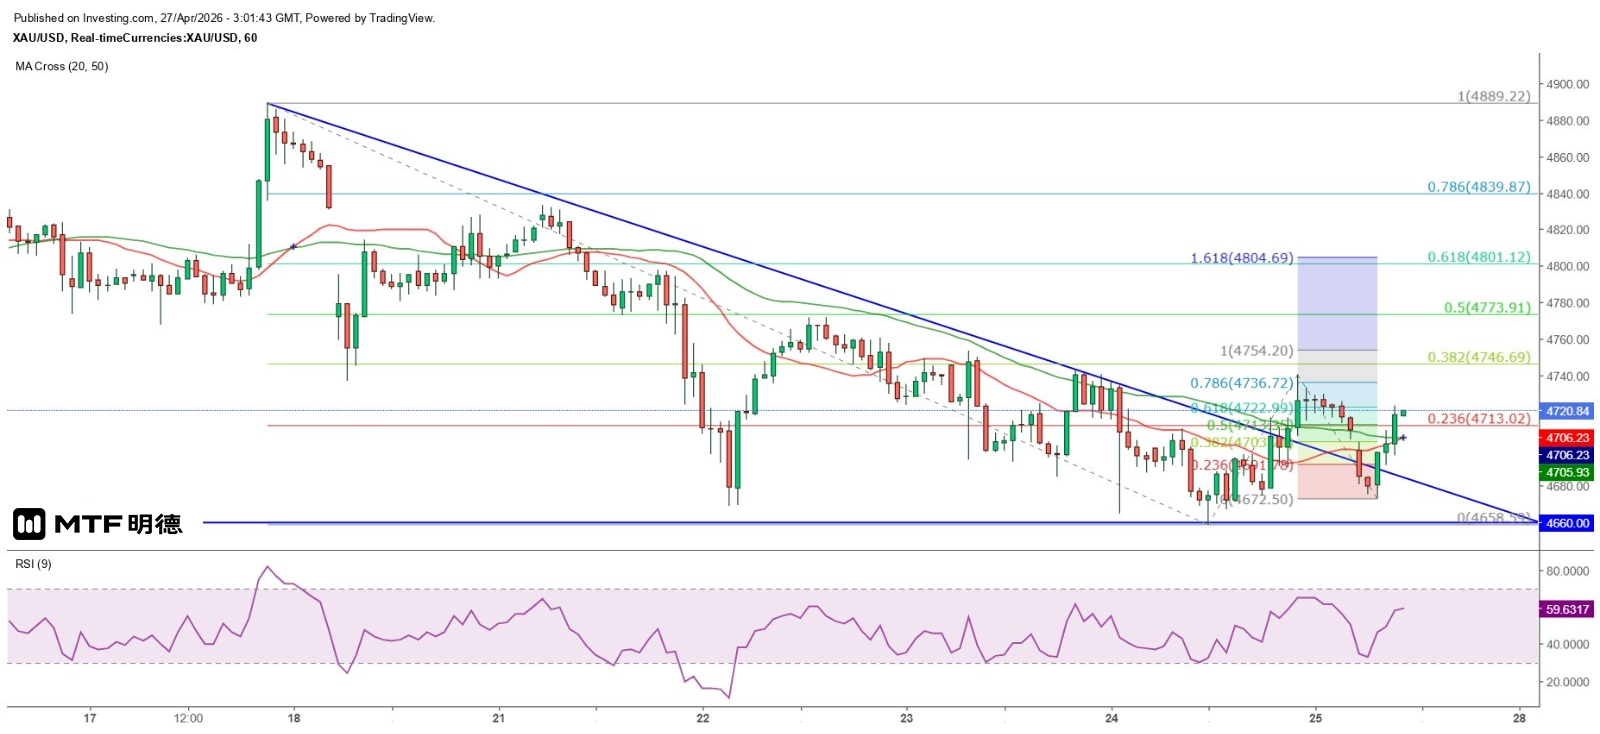
Gold prices are expected to continue rebounding intraday. 27/4/2026 11:01 Finalized The US and Iran have suspended negotiations. Iran has proposed to resume talks, suggesting that they first reach an agreement on reopening the Strait of Hormuz and lifting the maritime blockade, and postpone the nuclear talks. However, it is almost certain that Trump will not accept this, as it is a matter of cause and effect. Iran has been under blockade and international sanctions for decades precisely because of the nuclear issue. Now, it is obvious that the US blockade of the Gulf of Oman and the Arabian Gulf has prevented Iran from exporting oil and has caused losses of hundreds of billions of dollars. Iran knows that this cannot continue, so it has proposed to lift the blockade first. However, Trump has emphasized that Iran cannot possess nuclear weapons and will not back down on this stance. The US side is preparing to hold a meeting to discuss the current deadlock and possible measures in the next stage of the war. Therefore, it cannot be ruled out that the US military will launch another air strike against Iran to force it to reach a "nuclear-free agreement". This morning, the gold price first fell and then rebounded. The spot gold price opened lower with a gap, hitting a low of $4,672.5 before rebounding and recovering the falling gap, rising above $4,720. In contrast, the New York oil price opened higher with a gap and rose to $96.68, but then fell back to the $95 level. From the hourly chart, the gold price movement is in line with the prediction made last Friday that it would start a rebound wave at the beginning of this week. The spot gold price hit a low of $4,672.5 in the Asian market this morning and then formed a bullish candle with a higher low and higher high, breaking the pattern of each wave being lower than the previous one since April 17. Therefore, it is temporarily judged that the gold price will continue to rise within the day. The first resistance level is $4,773.91, followed by two important resistance levels at $4,804.69 and $4,810. The $4,710 and the low point in the Asian market this morning are expected to be the main support levels within the day. The above content is for reference only and does not constitute investment advice.
2026-04-24
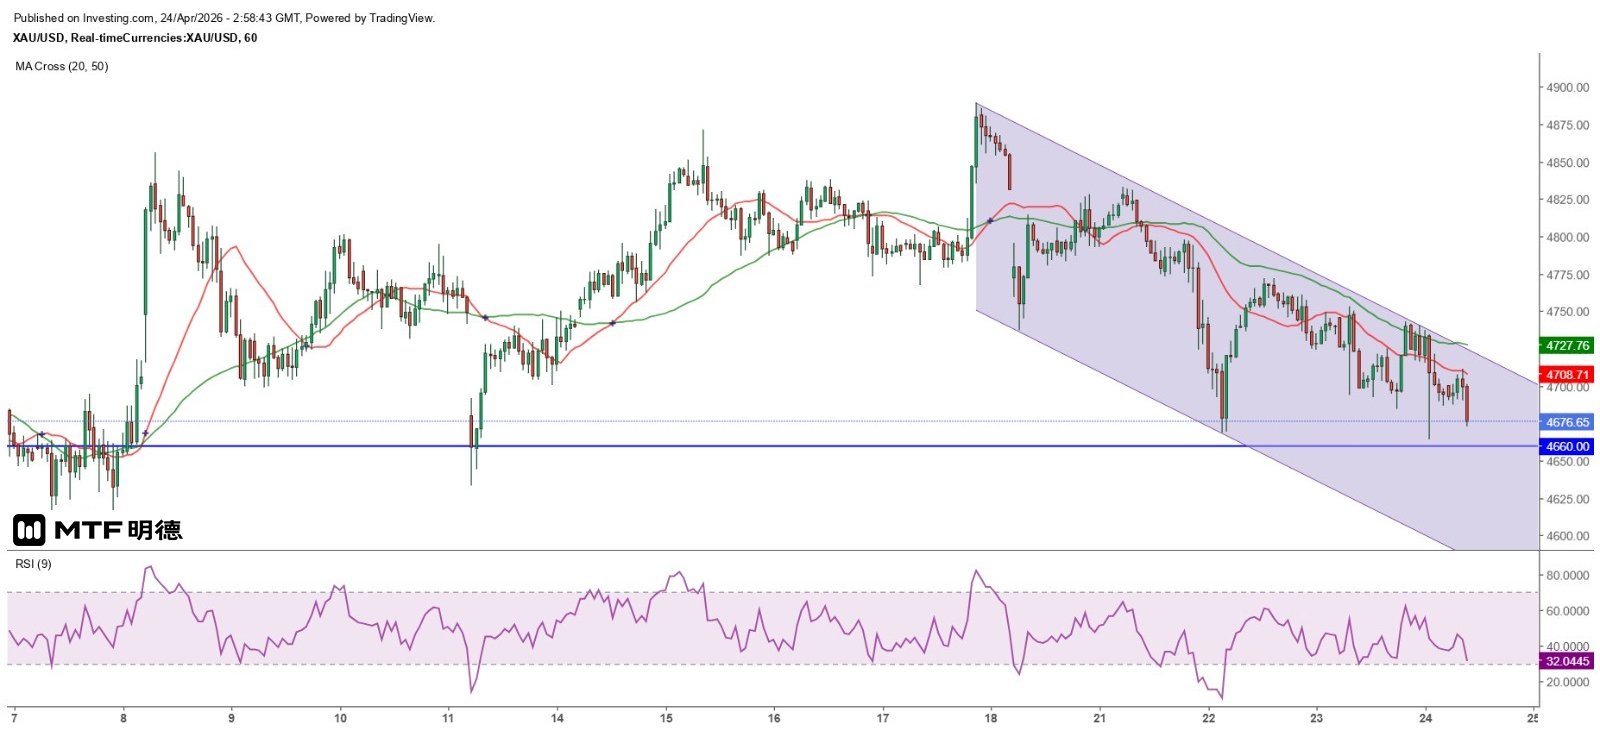
"Gold's Short-Term Rebound Expected to Remain Constrained by 50-Day Moving Average" 24/4/2026 10:55 Finalized The situation in the Middle East remains tense. The spot gold price plunged sharply to $4,664.59 in the early afternoon of New York yesterday, but then rebounded quickly to $4,721.45. However, it was constrained by the 50SMA on the hourly chart (currently around $4,728) and gradually declined. It hit a low of $4,682.37 in the early Asian session today before stabilizing temporarily. $4,700 has become the first resistance level for the intraday rebound. Spot gold prices have again found strong support above the Gann level angle of $4,660, and the current trend is in line with the previous prediction that gold prices would bottom out in the short term yesterday. Of course, the development of the US-Iran situation is an important factor affecting the prices of gold and oil, as well as the performance of the global financial market. If gold prices have indeed bottomed out in the short term as expected yesterday, a rebound wave should start today. Even if the market is concerned about changes in the US-Iran situation over the weekend and is reluctant to fully buy gold, as long as gold prices remain above $4,660, the possibility of a rebound wave starting early next week is very high. However, the 50SMA on the daily chart (currently around $4,862.7) remains the main resistance. If the US and Iran go to war again, the inverse relationship of gold falling and oil rising should not be underestimated. However, I must emphasize that this is event-driven and the resulting volatility can be extremely high. After a sharp rise or fall in the short term, the gold price is expected to fluctuate between 4,000 and 5,000 US dollars within the year. Additionally, from the daily chart, the gold price has been below the 20SMA (4,726) for the second day, seemingly attempting to break down. Therefore, 4,660 US dollars must not be lost. Once it is confirmed to be breached, the next key support level points to 4,410 US dollars. The above content is for reference only and does not constitute investment advice.
2026-04-23
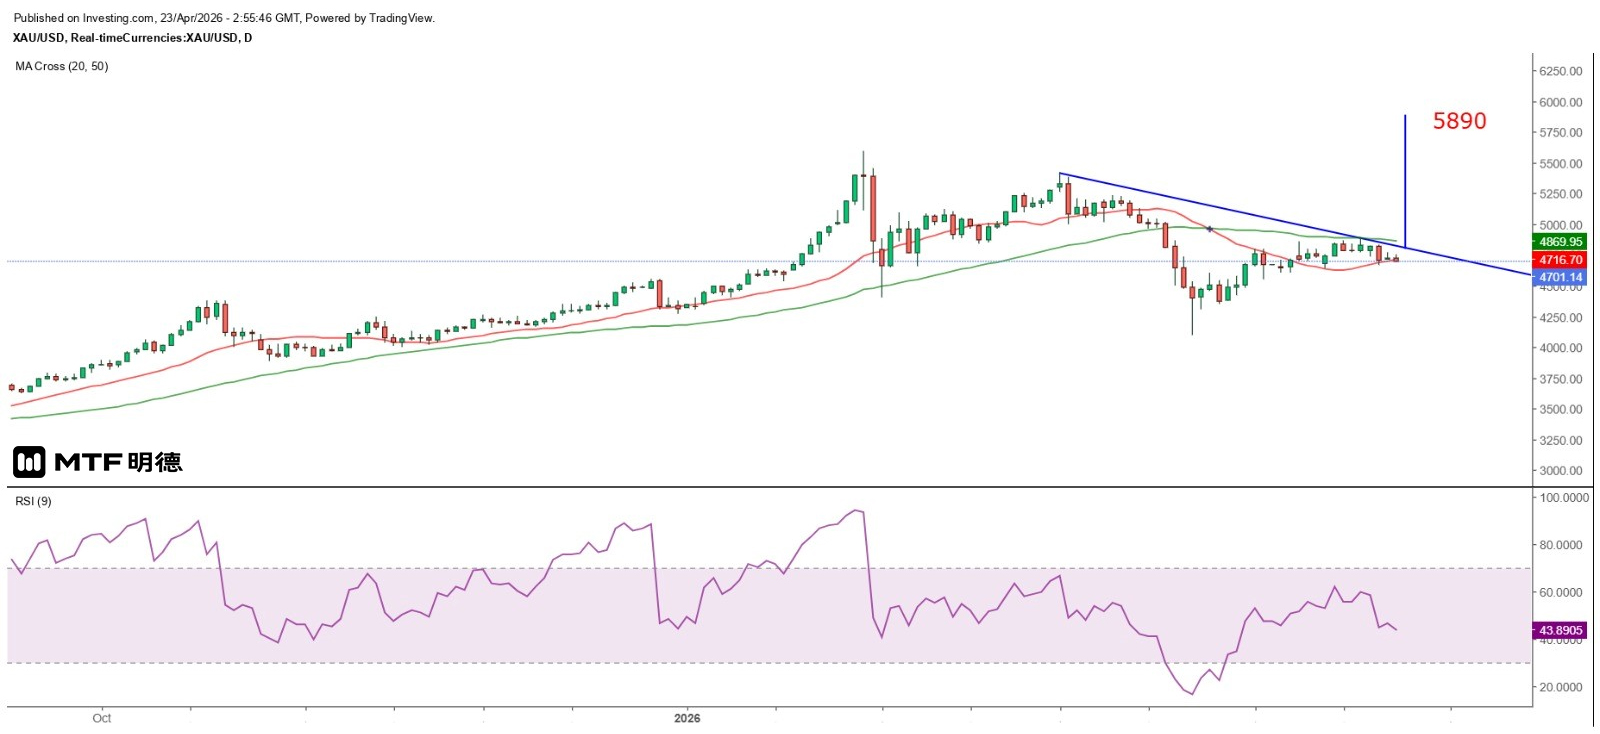
"Gold Price Could Soar Straight to $5,600 at Any Time" 23/4/2026 10:51 Completed On the surface, it seems that Iran's refusal to participate in peace talks forced Trump to announce the extension of the ceasefire agreement. However, it is also possible that Trump is using this as a way to buy time to increase the deployment of military forces in the Middle East. According to media reports, the US military has deployed three aircraft carrier strike groups - the USS Lincoln, the USS Ford, and the USS Bush - in the Middle East, along with over 50,000 troops, as well as a large number of naval, air, and missile defense forces. This is the largest deployment since 2003. Will a major war break out between the US and Iran as some commentators predict? If it really happens, the price of gold is very likely to soar, and the oil price may also experience a short-term sharp increase. However, as the situation of the war becomes clearer, the oil price is expected to drop rapidly, but the gold price may remain at a high level and fluctuate. Currently, Iran has once again blocked the Strait of Hormuz, while the US military has blocked the Arabian Gulf and the Gulf of Oman. If the two sides fail to start negotiations, this standoff will continue, which is unfavorable for Iran and the countries that must obtain oil from the Middle East. If the time is prolonged, eventually Iran will have to return to the negotiating table; otherwise, it will be the beginning of a war between the US and Iran! The development of gold prices is temporarily in line with yesterday's expectations. From the hourly chart, the spot gold price tested through $4,700 this morning, hitting a low of $4,694.23 before quickly rebounding to close at $4,747.54. However, it dropped again later, stabilizing at $4,705. The key now is whether the gold price can hold above yesterday's low of $4,660. Even if it fails to do so, based on the current 9RSI development on the hourly chart, a divergence at the bottom is possible. In other words, the main strategy at present is to wait for a low to buy. If short selling, the stop-loss level should be set at a maximum of above $4,753. The situation between the US and Iran is brewing major changes. At that time, it is not ruled out that the gold price will rise sharply to $5,600. Based on the current TD descending channel on the daily chart, the measured breakout could reach about $5,890. However, it is still not recommended for investors to hold positions over the weekend. The above content is for reference only and does not constitute investment advice.
2026-04-22
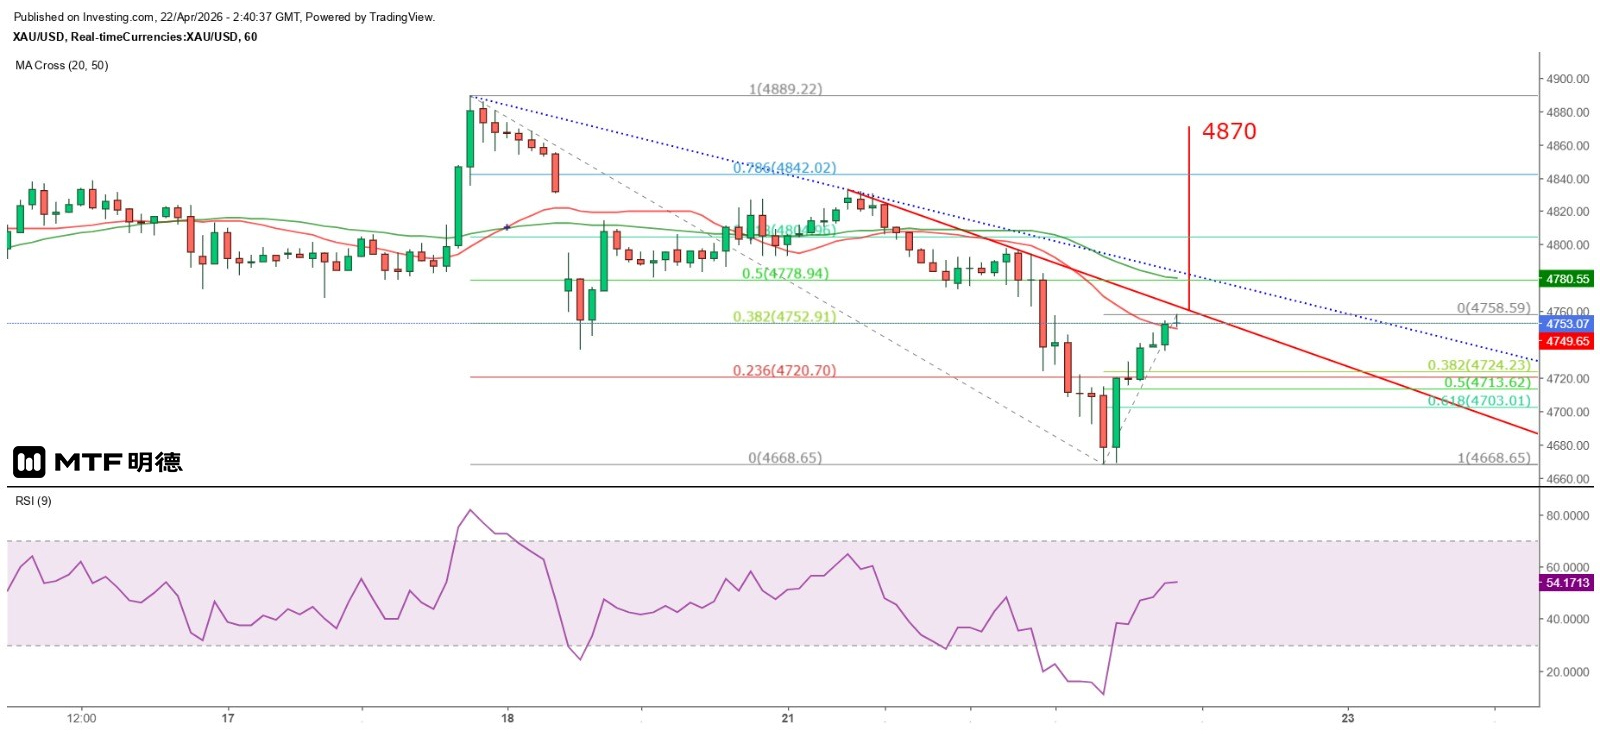
"Gold Prices May Form a Double Bottom Pattern in the Short Term" 22/4/2026 10:38 Completed Iran announced that it would not attend the US-Iran talks scheduled for today, citing the US blockade of the Gulf of Oman and the Arabian Gulf as a violation of the ceasefire agreement. Iran will continue to block the Strait of Hormuz. Iran's state television pointed out that Iran's participation in the talks must be conditional on not raising issues that infringe upon Iran's independence and dignity, with the top priority being Iran's defense and missile capabilities, as well as its nuclear capabilities and technology. On the US side, Trump has thus decided to extend the ceasefire agreement. According to the Associated Press, Iran's ambassador to the United Nations said that the Iranian government has received signals from the US that it is prepared to lift the blockade. The situation between the US and Iran remains volatile, and oil and gold prices continue to fluctuate significantly. New York crude oil broke through the downtrend line on the hourly chart, reaching a high of $92.2 in the late New York session before falling sharply. This morning, it was hovering below $90. Spot gold prices rebounded after hitting a low of $4,772.93 in the early European session, but failed to break through $4,800. It rose to a high of $4,797.84 before continuing to decline, falling to $4,668.65 in the late New York session. It then staged a V-shaped rebound, rising to a high of $4,758.18 this morning. Gold prices yesterday approached the strong support level of $4,660, which is close to the 45-degree angle of Gann's square, indicating that the short-term price is likely to fluctuate between $4,660 and $4,810. From the hourly chart, the 50SMA is currently at $4,780, and the old TD downtrend line and the 50% retracement of the largest decline since last Friday are both very close to the 50SMA, suggesting that the technical resistance near $4,780 is extremely strong. Investors should not mistake this as meaning that $4,780 cannot be broken through. Instead, the greater the resistance, the stronger the upward momentum will be once it is broken. Based on the latest TD downtrend line, if it is broken through, the measured upward target is $4,870. Judging from the current situation, the short-term bottom is expected to appear tomorrow. Therefore, it is inferred that the gold price may form a double bottom pattern with yesterday's low. If it retraces to $4,724 or $4,713 within the day, it should be a relatively ideal entry point, and the 50SMA will be the first profit-taking target. The above content is for reference only and does not constitute investment advice.
2026-04-21
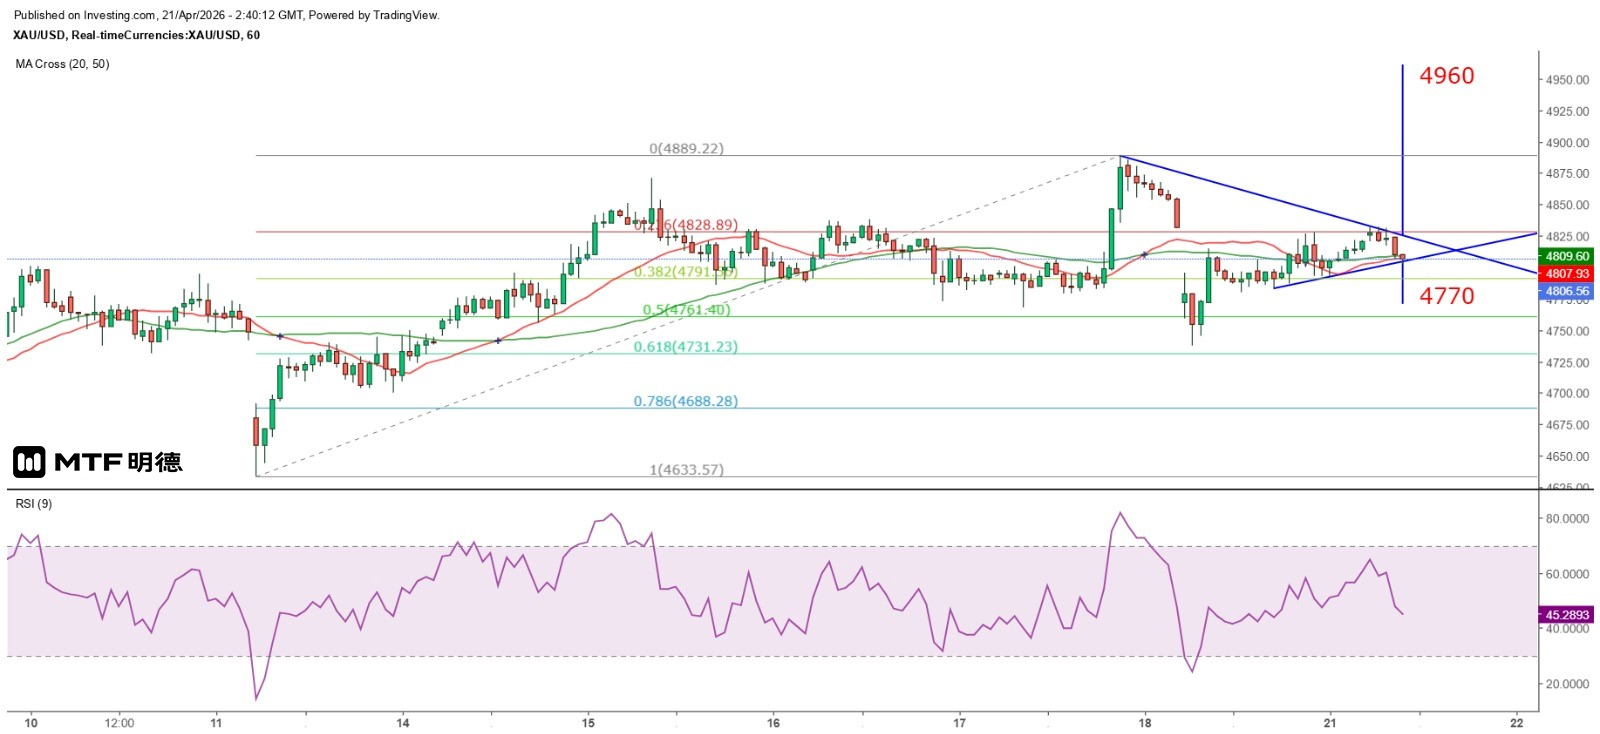
"Gold Prices Weaken Gradually, Awaiting a Counterattack Opportunity" 21/4/2026 10:38 Completed The situation between the United States and Iran is approaching a critical point. The ceasefire agreement expired on Wednesday. Before that, if the two sides failed to reach a consensus on the nuclear issue, according to Trump's latest statement, it would be "almost impossible" for him to extend the ceasefire and he would instead resume military strikes. However, US Vice President Pence has arrived in Islamabad, the capital of Pakistan, and the two sides are about to start a new round of negotiations. On the Iranian side, it is reported that the Islamic Revolutionary Guard Corps has asked Iranian negotiators to maintain a tough stance. Some senior members of the Iranian parliament also said that the country would not do anything at all costs for the negotiations. After several rounds of "fire drill" exercises before, investors should be mentally prepared that even if the two sides fail to reach an agreement, it is not expected to cause significant fluctuations in the financial market. The spot gold price rebounded to a high of $4,833.09 in the Asian market this morning, completely filling the gap left by yesterday's decline. Subsequently, the gold price dropped again and broke through the 50SMA (about $4,809) and 20SMA (about $4,808) that had been moving horizontally for a long time on the hourly chart. The $4,810 level on the Gann 45-degree angle was lost again. Does this indicate that the gold price will further test the lower level of $4,760, or even move towards the stronger support level of $4,660? From the hourly chart, the gold price has tested through the TD ascending track of the hourly chart. However, based on the gap between the large bearish candle of the previous hour and this line, even if the ascending track is tested through at 10 a.m. in the one-hour chart, it is mostly a false break. But if the break is confirmed, the current measured decline target is approximately $4,770. Conversely, if it breaks through the TD descending track, the measured rise target is approximately $4,960, which is exactly the strong resistance at $4,960 where the Gann 90-degree angle is located! From this, it can be inferred that the gold price is likely to decline gradually, waiting for the right moment to make a major counterattack. Whether to sell first and then buy, or wait for the right moment to gain greater profits, it all depends on the investor's values! The above content is for reference only and does not constitute investment advice.


