
 en-US
en-US 

 Telegram
 WeChat

2026-02-13
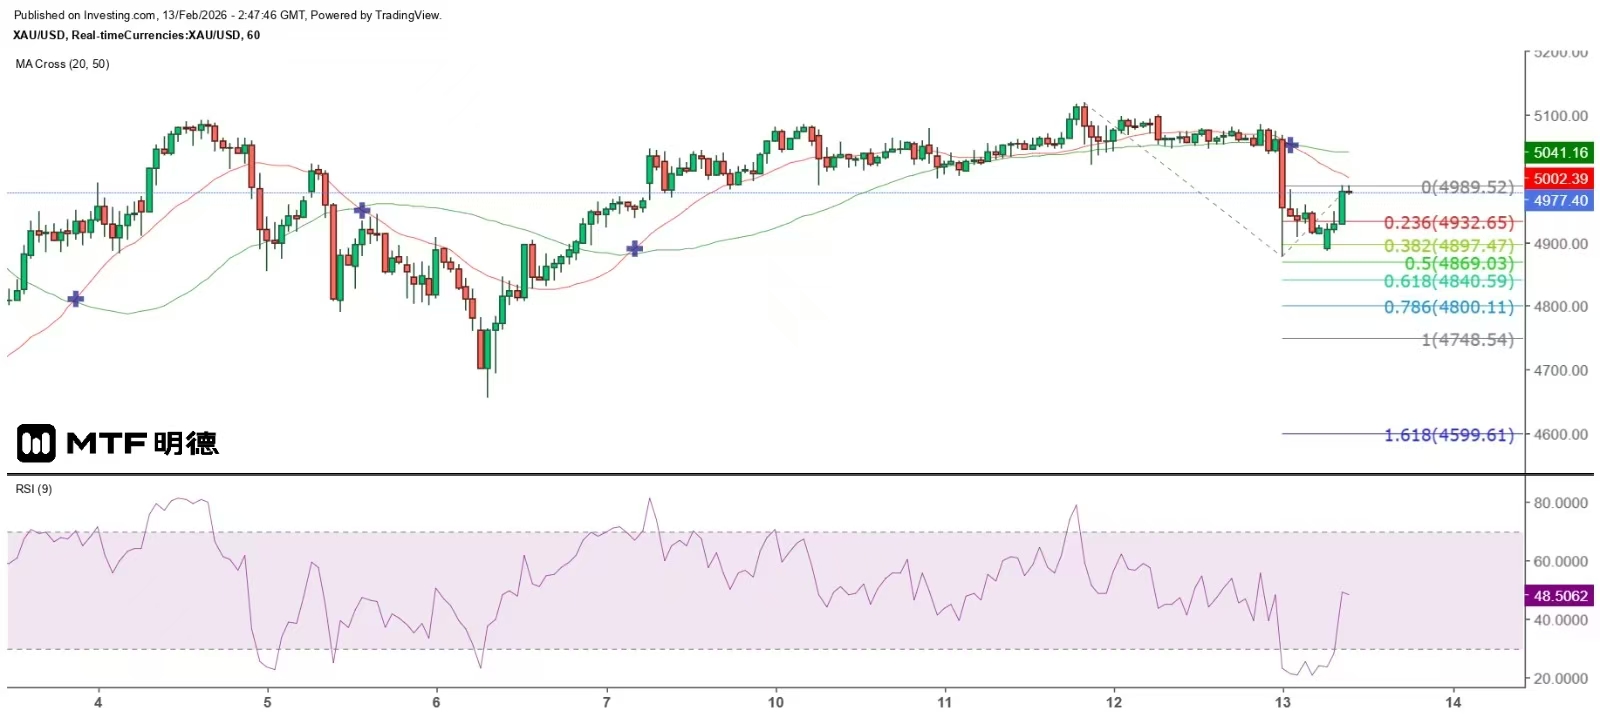
"Gold Prices Tend to Gradually Decline in the Future" 13/2/2026 10:45 Completed Yesterday, gold prices remained above $5,045 for most of the day, but dropped sharply after the London market closed, breaking through the bottom of the sideways range. The lowest point reached was $4,878.24. This seems to be due to the stronger-than-expected US non-farm payroll report for January. Additionally, the US will release the January consumer price index (CPI) tonight. It is expected that the overall CPI increase will drop from 2.7% to 2.5% year-on-year, and the core CPI increase is expected to fall from 2.6% to 2.5% year-on-year. However, the strengthening of employment data exerts upward pressure on inflation. Moreover, the market currently expects the Federal Reserve to not cut interest rates until June at the earliest. During the three months before that, gold prices lack the impetus of interest rate factors, and the US economic data is not entirely negative, increasing the pressure for gold prices to correct. From the daily chart, the gold price rebounded to a high of $5,119.24 this week, approaching the 61.8% retracement level of the largest decline from the historical high of $5,595.46, which is $5,140.37. However, it dropped sharply yesterday and broke below the 20-day SMA (currently around $4,746). This morning's rebound high of $4,986.31 was close to the 50% level of yesterday's largest swing ($4,889.37), and then it fell sharply again and tested below $4,980. From this, it can be inferred that the rebound in the daily chart has ended, and the rebound in the hourly chart has also been blocked at the good-bad dividing line, increasing the risk of further decline significantly. Measuring the daily chart's trend with Fibonacci extension lines, if the extension reaches 100%, the gold price will fall to $3,927.9. If the hourly chart is used as the benchmark and the historical high is taken as the starting point, and if it also reaches 100%, the gold price could fall to $4,748.54. From Gann's square perspective, the gold price is currently fluctuating within the range of $4,960 to $5,010, but it is testing the lower-level fluctuation range of $4,960 to $4,910. Since the gold price broke through $4,900 yesterday, it is highly likely to test this level again or even fall below it. As $4,960 is at a 90-degree angle, it will become a strong resistance for the gold price's future rebound. The gold price is expected to gradually test the lower levels in the future. The above content is for reference only and does not constitute investment advice.
2026-02-12
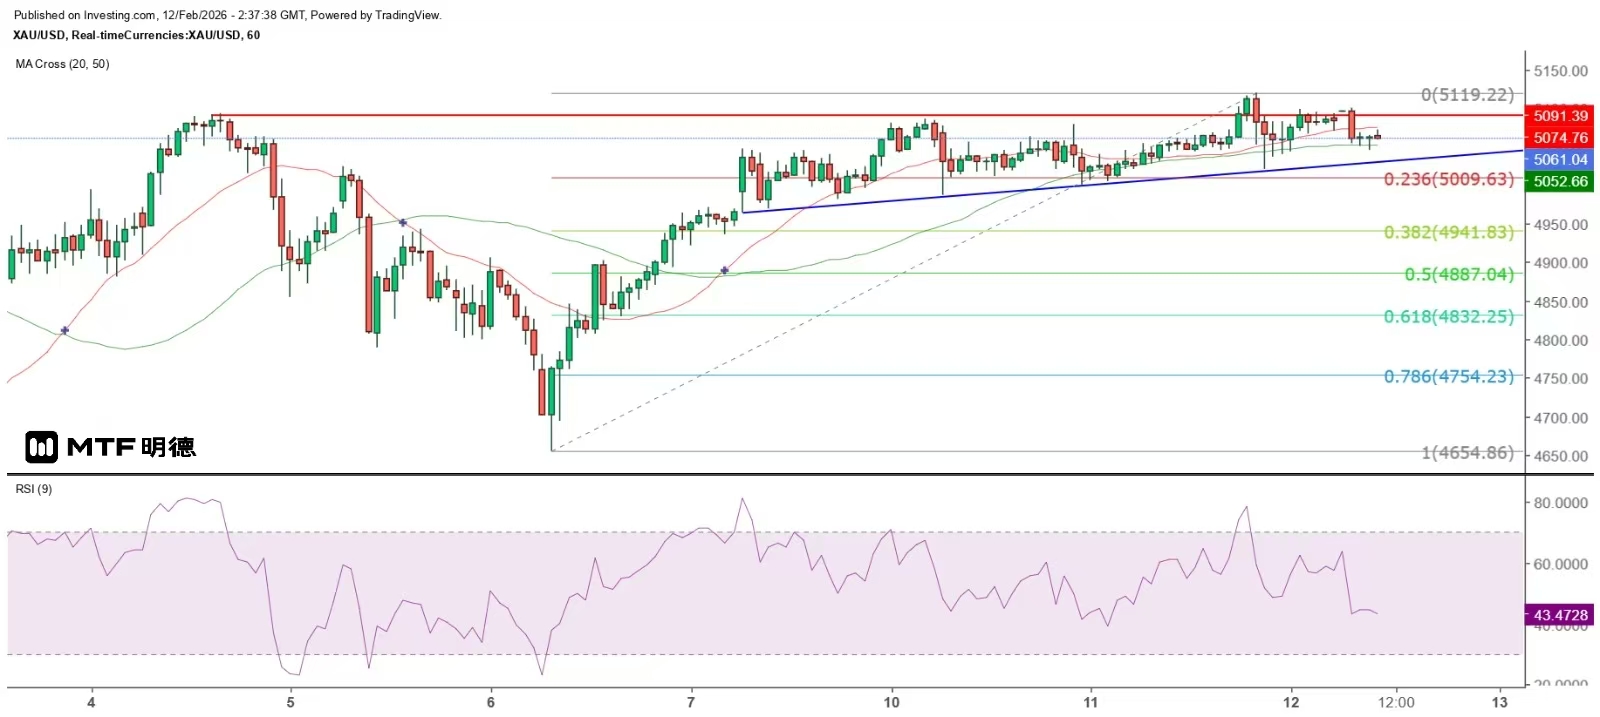
"Gold Price Fluctuates but Market Pattern Remains Unchanged" 12/2/2026 10:36 Completed The U.S. added 130,000 non-farm jobs in January, far exceeding the expected 66,000. Among them, private sector jobs increased by 172,000, more than twice the expected 70,000. The unemployment rate dropped from 4.4% to 4.3%, and the average hourly wage rose by 3.7% year-on-year. The data was stronger than expected, causing gold prices to plunge sharply. Spot gold prices dropped from $5,084 to $5,020. However, it gradually recovered lost ground and reached a high of $5,098 in the New York midday session. It was constrained by the $5,100 mark and retreated to $5,067, then fluctuated upward. This morning, the gold price opened higher in the Asian market with a gap and once reached as high as $5,100.5. However, it was again blocked and dropped sharply, hitting a low of $5,045.83 before rebounding continuously. It is currently hovering below $5,070. Although the gold price rose to $5,119.22 in the early part of the New York market yesterday, it quickly fell back. However, investors should note that from the hourly chart, the gold price has broken through the resistance of the descending track of the narrowing triangle and closed above $5,111.95. Moreover, the overall trend has been gradually rising since the beginning of this week. If it can continue to close above $5,047 in the short term, it is expected to maintain an upward trend. Besides $5,047, the lower limit of the upward gap on Monday, $4,964.73, is even more crucial. If this level is breached, it indicates that the gold price is adjusting in a double top pattern, and the possibility of testing the neckline at $4,654.86 in the future will increase. Although the gold price closed above $5,100 on the hourly chart yesterday, it then experienced a double-line decline with a lower high and lower low. This morning's sharp drop also led to a large bearish candle on the hourly chart, with the top of $5,100.5 becoming an important resistance level for the day. It can be seen that $5,100 and $5,110 remain strong short-term resistance levels for the gold price. If these levels are broken, it is necessary to manage risks carefully when chasing higher prices. After the significant fluctuations, the gold price is still trading within the range of $5,000 to $5,100. Before a major breakthrough occurs, it is still advisable to adopt a range-bound trading strategy. The above content is for reference only and does not constitute investment advice.
2026-02-10
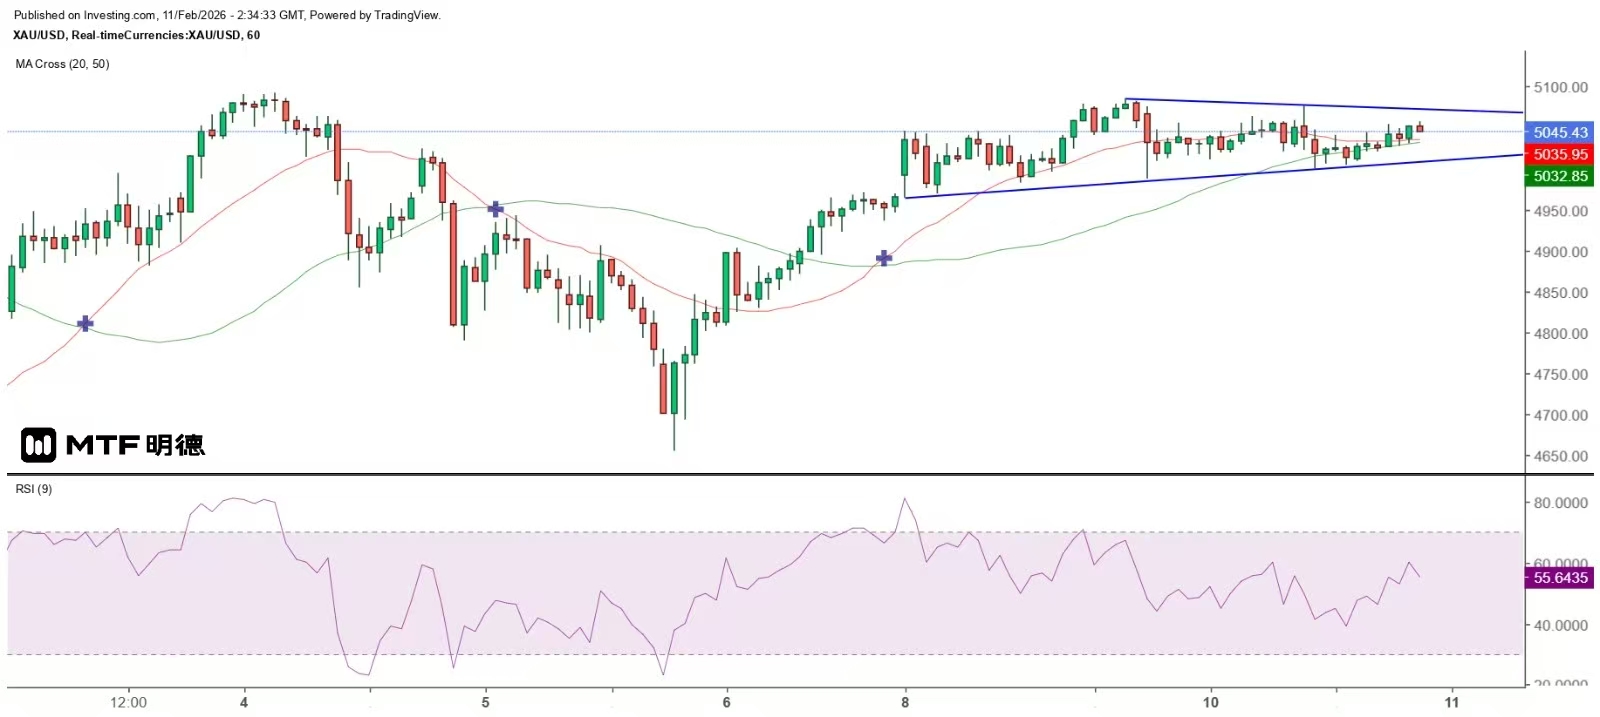
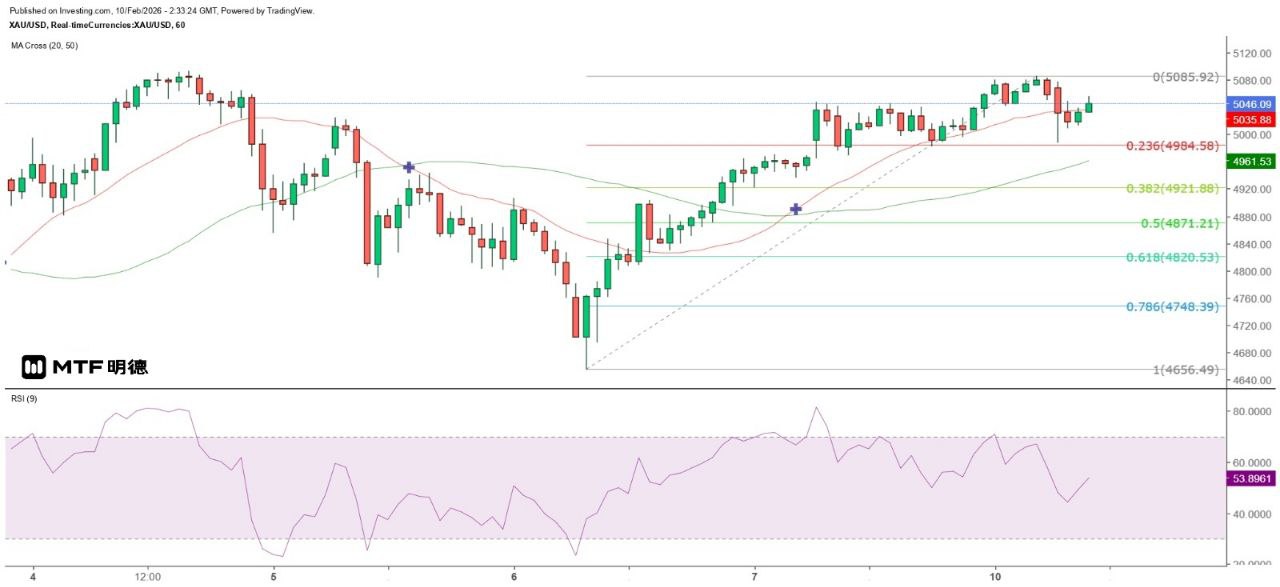
"Gold Prices Expected to Fluctuate in the Short Term" 10/2/2026 10:30 Completed Spot gold prices, as expected, formed a double top pattern on the hourly chart. Yesterday, gold prices opened with a gap higher and then consolidated sideways above $4,980. In the early part of New York trading, it broke above the Asian session's high of $5,046.79 and reached a high of $5,085.92 towards the end of the New York session before reversing and falling. In the early part of today's Asian session, it dropped to a low of $4,987.87. Technically, this forms a double top with the high of $5,092.31 on February 4th. It also indicates that the resistance at $5,100 and $5,110 (which is at the 135-degree angle of the Gann Square) is very strong. In the short term, gold prices are likely to fluctuate around the $5,100 mark. Additionally, gold prices dropped below the 20SMA on the hourly chart (currently around $5,035.5) this morning, but have since gradually rebounded and temporarily returned above this line. However, a break above the top of the large bearish candle at $5,076.45 is necessary for another attempt to challenge $5,100. Otherwise, it is still regarded as a rebound within a descending flag pattern. From the double top formation on the hourly chart, $4,654.86 is seen as the neckline support, which is lower than the 61.8% retracement target of the previous uptrend at $4,664.35, indicating a weak trend in gold prices. The risk factor that may exert short-term pressure on the gold price is believed to be the January non-farm payroll report to be released by the US Department of Labor tomorrow. The market expects an increase of 70,000 jobs, far exceeding the 50,000 in December, and the unemployment rate is expected to remain at 4.4%. Therefore, it is unlikely that the gold price will break through the double top on the hourly chart before the data release. Unless the US employment data is disappointing, the gold price is expected to fluctuate between $4,960 at the 90-degree angle of the Gann Square and $5,110 at the 135-degree angle in the short term. The above content is for reference only and does not constitute investment advice.
2026-02-09
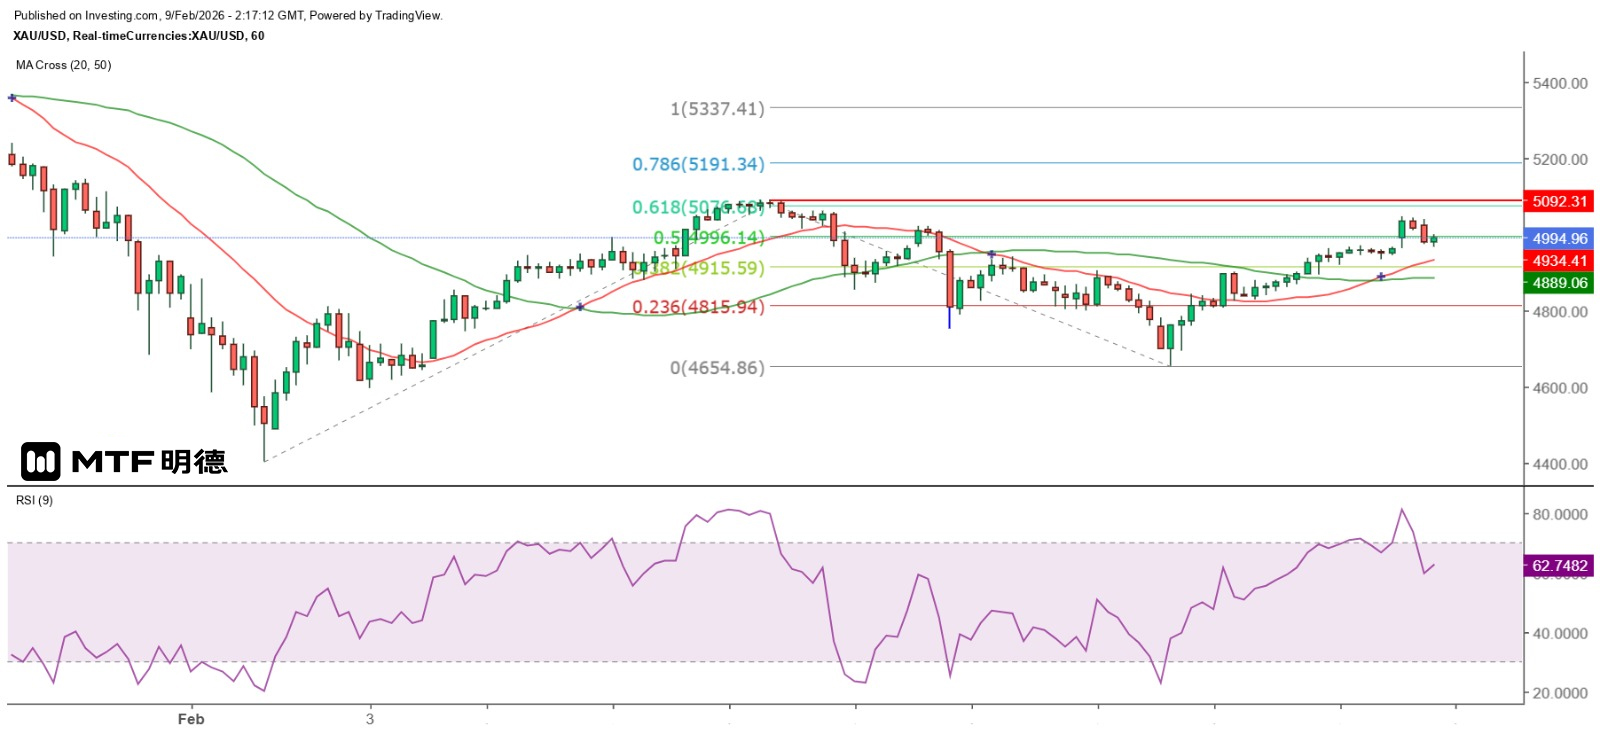
"Gold Price Expected to Challenge $5,110" 9/2/2026 10:15 Completed Although the gold price rose repeatedly throughout last Friday, it failed to break through the $5,000 mark. However, this morning in the Asian market, it opened with a gap and broke through the $5,000 threshold, reaching a high of $5,046.79. It then fluctuated and dropped to a low of $4,976.52 before rebounding again and once more rising above the $5,000 level. Gold prices gapped up in the Asian market, likely related to the Liberal Democratic Party's (LDP) sweeping victory in Japan's House of Representatives election. The LDP won 316 seats in yesterday's election, accounting for nearly 68% of the 465 contested seats, exceeding two-thirds. This is the largest number of seats the LDP has won in the House of Representatives since World War II. Additionally, the Japan Innovation Party, which forms a coalition government with the LDP, also secured 36 seats, bringing the coalition's share of seats in the House of Representatives to 75.7%. The LDP once again became the largest party in the House of Representatives, which is conducive to smooth governance in the future. The key short-term support level is $4,960. However, the landslide victory of the Liberal Democratic Party led by Kishida Fumio has raised concerns among the market about the deterioration of Sino-Japanese relations, providing an excuse for the sharp rise in gold prices. But the Nikkei index also opened higher this morning and reached a new record high of 57,629.5 points, reducing market risk aversion. The USD/JPY pair rebounded from the intraday low of 156.22 to 156.68, and the rebound in gold prices was short-lived, with the $5,000 level regained and then lost again. From the hourly chart, the upward pattern of gold prices has not been disrupted. However, the recent range has expanded to over 100 dollars, widening the gap between the high and low points. Technically, the first support level is at 4964.73 dollars, the early Asian session, and the 20SMA (currently around 4933.55) is the next important support. It should be noted that 4960 dollars is at a significant support level (or resistance) at the 90-degree angle of the Gann Square. Therefore, it is expected that gold prices will consolidate above 4960 dollars and then break through the 5000-dollar mark to challenge 5110 dollars. However, investors should still be aware that the previous high of 5092.31 dollars may become a double top resistance during the process of gold prices challenging 5110 dollars. The above content is for reference only and does not constitute investment advice.
2026-02-06
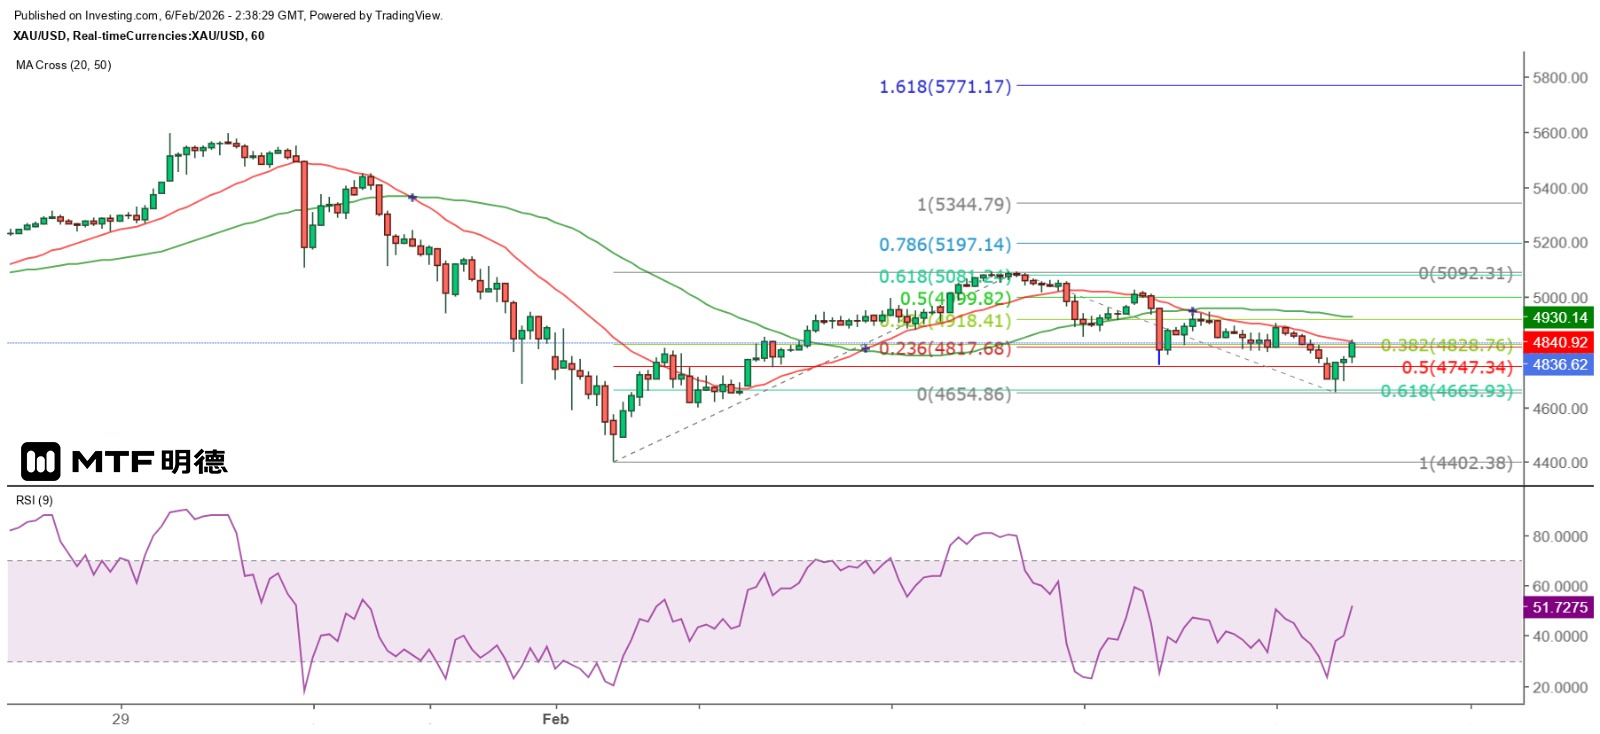
"Gold Price May Again Challenge $5,000 in the Short Term" 6/2/2026 10:37 Completed Yesterday, the gold price trended downward repeatedly. After a sharp drop to $4,806.46 in the early Asian session with a large bearish candle, it gradually rebounded but fell again after reaching a high of $4,933.88, clearly constrained by the top of the large bearish candle at $4,961.73. After rebounding to $4,906.75 after the London close, it dropped again and reached a low of $4,759.27 before the New York close, which was extremely close to the measured decline target of $4,755 mentioned yesterday. This morning, the gold price opened lower and continued to decline, reaching a low of $4,654.86. Subsequently, it rose repeatedly, and the 5-minute chart showed a pattern of each wave being higher than the previous one. If it reaches the 100% Fibonacci extension level, the gold price could reach $4,803.73. If it reaches 1.618 times, it could reach $4,871.56. This morning, the gold price consolidated slightly at a level slightly below $4,800 and then broke out sharply upward, breaking through the secondary resistance of the Gann 45-degree angle at $4,810, increasing the possibility of the gold price challenging the $5,000 mark again in the short term. From the hourly chart, the low point of the gold price adjustment yesterday has slightly fallen below the 61.8% retracement level of the largest increase since February 2nd. Subsequently, a rebound wave has emerged, indicating that the short-term adjustment is likely to have ended. If analyzed with the wave theory, the gold price may have completed the second wave adjustment. Assuming that the third wave is 1.618 times the first wave, the gold price could rise to $5,771.17. Even if calculated at a simple 1:1 ratio, the gold price could still rise to $5,344.79. The above content is for reference only and does not constitute investment advice.
2026-02-05
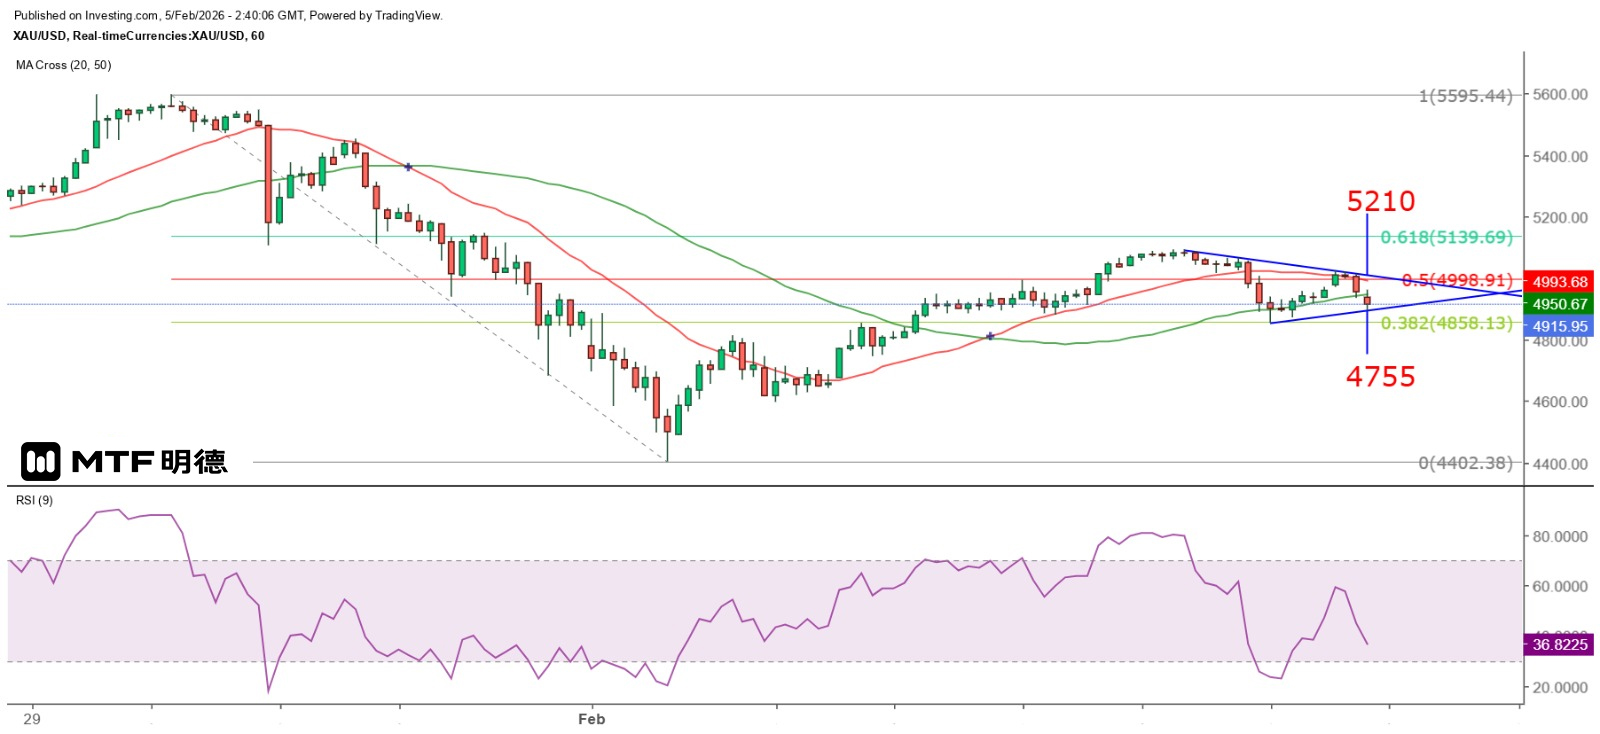
"Gold Prices Consolidate in a Narrowing Triangle, Awaiting a Breakout" 5/2/2026 10:39 Completed Yesterday, ADP in the United States announced that the number of jobs in private enterprises increased by 22,000 in January, which was less than the expected 46,000. The number of new jobs in December was also revised down from the initially reported 41,000 to 37,000. The data indicates that the U.S. labor market remains weak. Among them, small businesses saw no change, medium-sized businesses added 41,000 jobs, and large enterprises lost 18,000 jobs. Dr. Nela Richardson, the chief economist of ADP, pointed out that employment growth declined last year, with private enterprises adding 398,000 new jobs, less than the 771,000 in 2024. However, despite the continuous significant slowdown in employment growth over the past three years, salary growth has remained stable. The market expects that the number of non-farm jobs in the US, as announced by the Department of Labor on February 11, will increase by 7,200 in January, which is less than the 8,200 increase in December. However, the growth of employment positions in the US has dropped sharply from 53,600 in November last year to less than 10,000, which is quite unusual. This might be affected by Trump's immigration policy, government shutdown and weather conditions. The Department of Labor stated that it has been fully operational since February 4. I estimate that the growth of non-farm jobs in March will return to five figures or above. Gold prices rose close to $5,100 yesterday but were held back. For most of the day, they formed a large round top pattern. The poor ADP employment data only led to a slight rebound in gold prices, but they failed to break through the high of $5,092.31. Subsequently, they fluctuated and fell, eventually hitting a new intraday low of $4,855 before gradually recovering. This morning, they rose to a high of $5,023.81 before falling again and even breaking through $4,900, reaching a low of $4,896.2. From the hourly chart, the recent cumulative rebound in gold prices exceeded 50% of the earlier maximum decline, but it did not reach 61.8% before falling back. Since yesterday, the trend has been a narrowing triangle, indicating that gold prices are in a consolidation and waiting stage. A break above $5,023.81 or below $4,855 will be considered a breakthrough. The measured target for an upward breakthrough is $5,210, while the measured target for a downward breakthrough is $4,755. Judging from the current trend, the possibility of a downward breakthrough is greater. The above content is for reference only and does not constitute investment advice.
2026-02-04
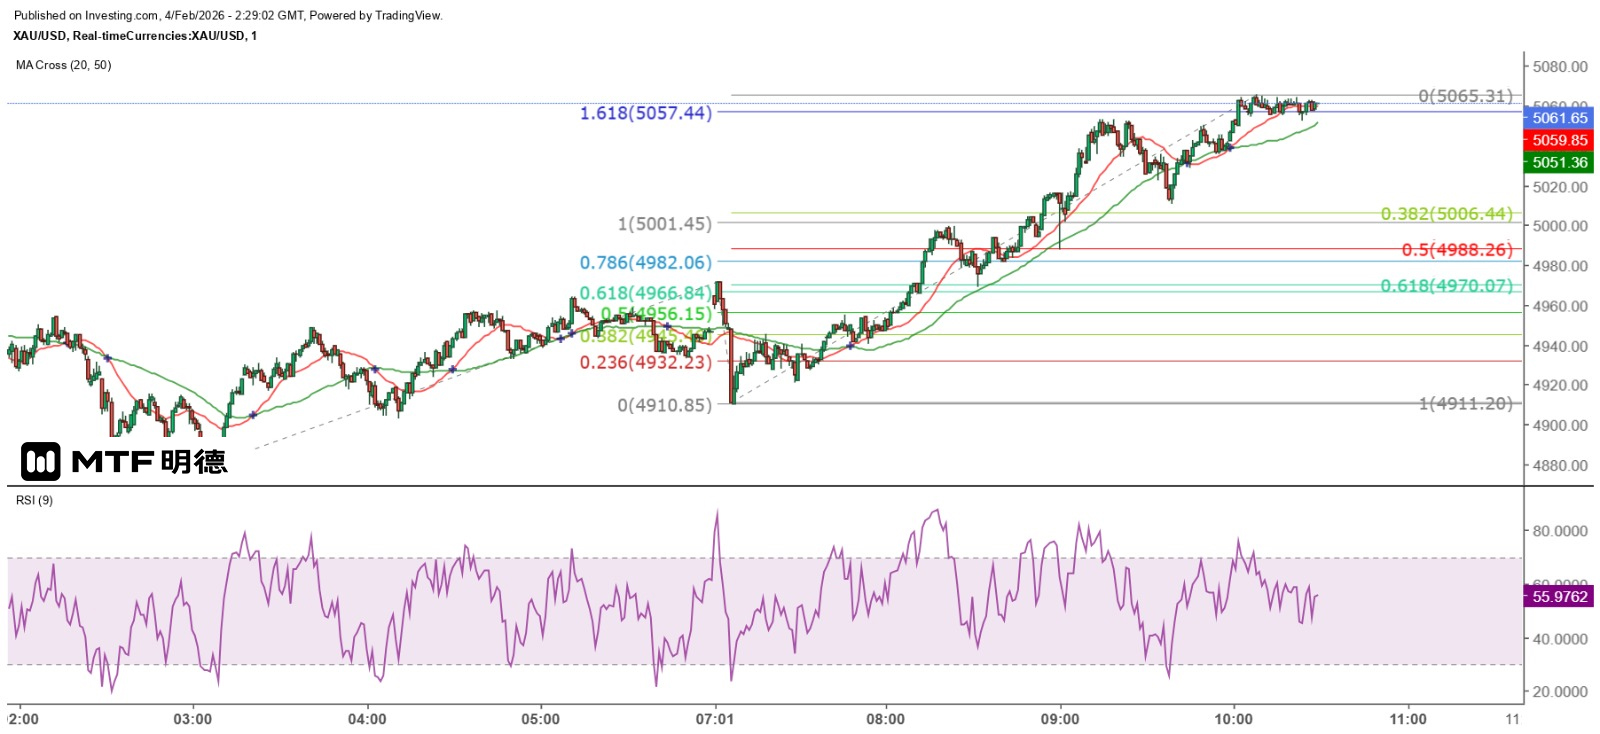
"Gold Price Holds Steady at $5,000, Continues to Test Higher Levels" 4/2/2026 10:26 Finalized Recently, the gold price has been fluctuating significantly, with gains or losses of tens of dollars within minutes. Investors who are well-planned and not overly greedy should be able to profit in 90% of cases. The key is not to operate on a large time frame. The daily chart should only be used as a directional reference and is not an ideal indicator for entering or exiting the market. I mentioned before, and it is the strategy I currently use most often, that the time frame should be 1 and 5 minutes, and 20 and 50 SMA should be used as support or resistance for taking action. Even simpler, just using 1 minute and 20 SMA is enough to win. At most, add 9 RSI as a warning signal. Once it reaches 85 or above, start to be cautious in operation. Given that the daily fluctuation of the gold price is often over 100 to 200 dollars, there is no need to refer to lagging technical indicators at all! Spot gold prices continued to decline in the New York midday session yesterday, hitting a low of $4,881.13 towards the end. Subsequently, a rebound wave began, and today, in the early Asian session, it broke through the $5,000 mark, briefly rising above $5,050 before pulling back. However, after falling to $5,010.84, it started to climb again. $5,010 is the price level after the 90-degree angle of Gann's 4,960, but it is neither a significant nor a secondary resistance level. Therefore, the key support levels remain at the $5,000 mark and $4,960. If gold prices can hold above $5,000, the next target for a challenge will be the 135-degree angle at $5,110. From the hourly chart, the rebound of gold prices from the low point on Monday has exceeded 50% of the recent maximum decline. Currently, it is moving towards a 61.8% rebound. If it reaches this level, the gold price will rise to $5,139.70, which will break through the $5,110 level at a 135-degree angle. Since this level is not a significant resistance (or support), after breaking through, the gold price is likely to rise to $5,260 at a 180-degree angle before encountering significant resistance. The above content is for reference only and does not constitute investment advice.
2026-02-03
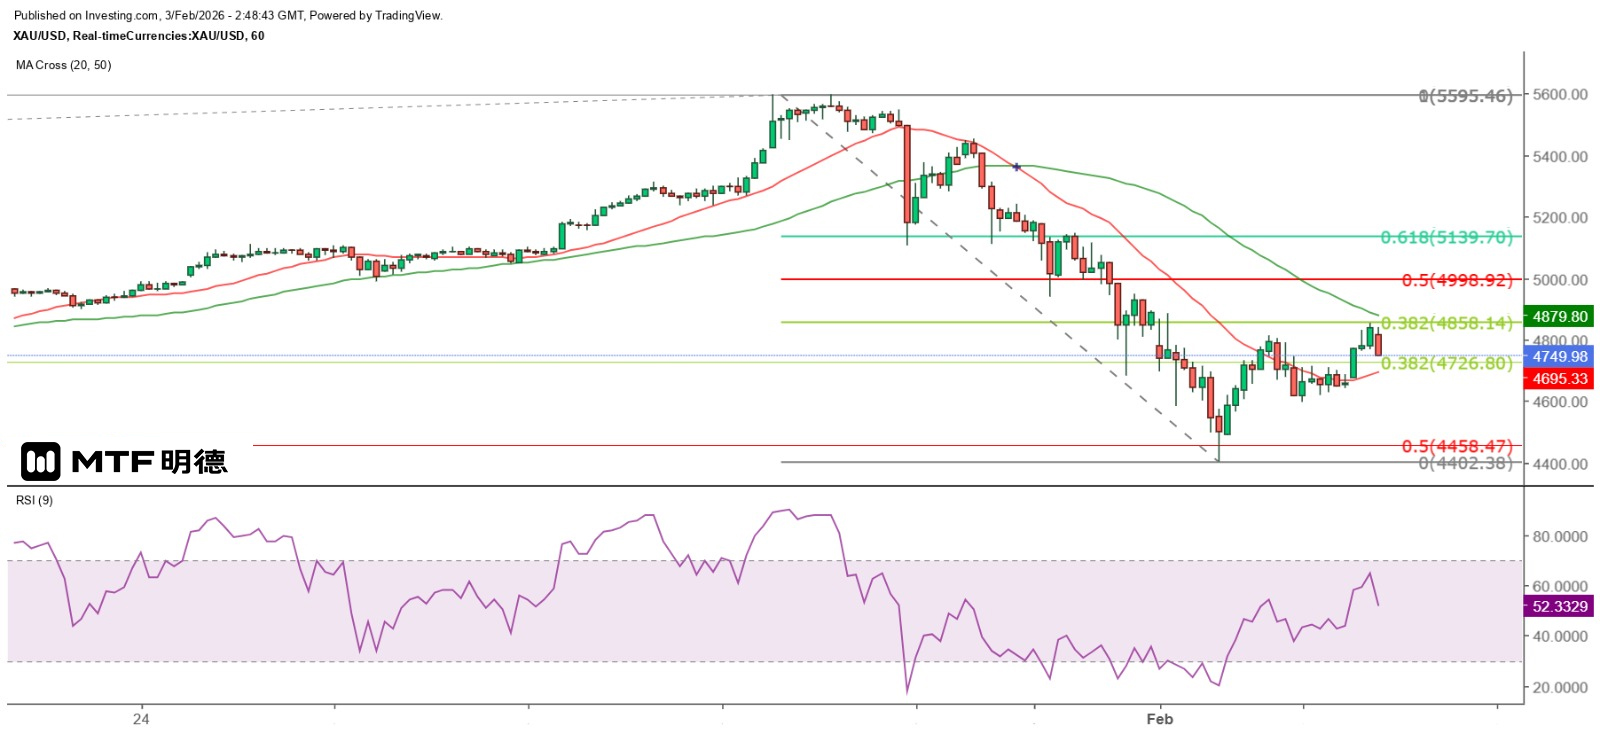
"Gold Price Expected to Initiate a Rebound Wave" 3/2/2026 10:47 Completed At the opening of the European market yesterday, the spot gold price further dropped to $4,402.38 and then began to rebound. It did not reach a new intraday low in New York and rose to $4,855.93 in the early Asian session. From the hourly chart, the gold price formed a pattern of each wave being higher than the previous one. The first rebound high was $4,812.40, and then it fell again, reaching a low of $4,597.02, which was slightly above the important resistance level of $4,810 I mentioned yesterday before falling again. This morning, the rebound in gold prices was clearly constrained by the 50SMA (4880) on the hourly chart, and then it pulled back again. As it has broken through the 20SMA (4696), this line can be regarded as the first important support. Optimistically, it is expected that gold prices will consolidate between the 20SMA and 50SMA in the short term, and then break above the 50SMA to challenge the $5,000 mark. The 50% retracement of the biggest decline since last Thursday is at $4,998.92, indicating that $5,000 is a strong resistance level for the short-term rebound in gold prices. On the contrary, if the gold price is constrained by the 50SMA on the hourly chart and continues to decline, as seen on the 1-minute chart, the gold price fell to $4,760.02 this morning and has been fluctuating in a dense range, indicating that a breakthrough movement is about to occur. If the gold price breaks below the 20SMA and tests the previous low of $4,402.38, it is highly likely to form a double bottom pattern. During this period, $4,597.02 can be regarded as the first important support level. If the gold price tests the previous low but does not break through this level and turns strong again, it is expected to launch a 3rd wave, and the rebound wave starting from yesterday's low can be regarded as the 1st wave. If the 3rd wave is equivalent to 1.618 times the 1st wave, the gold price can rise by $733.84 from the previous low. The above content is for reference only and does not constitute investment advice.
2026-02-02
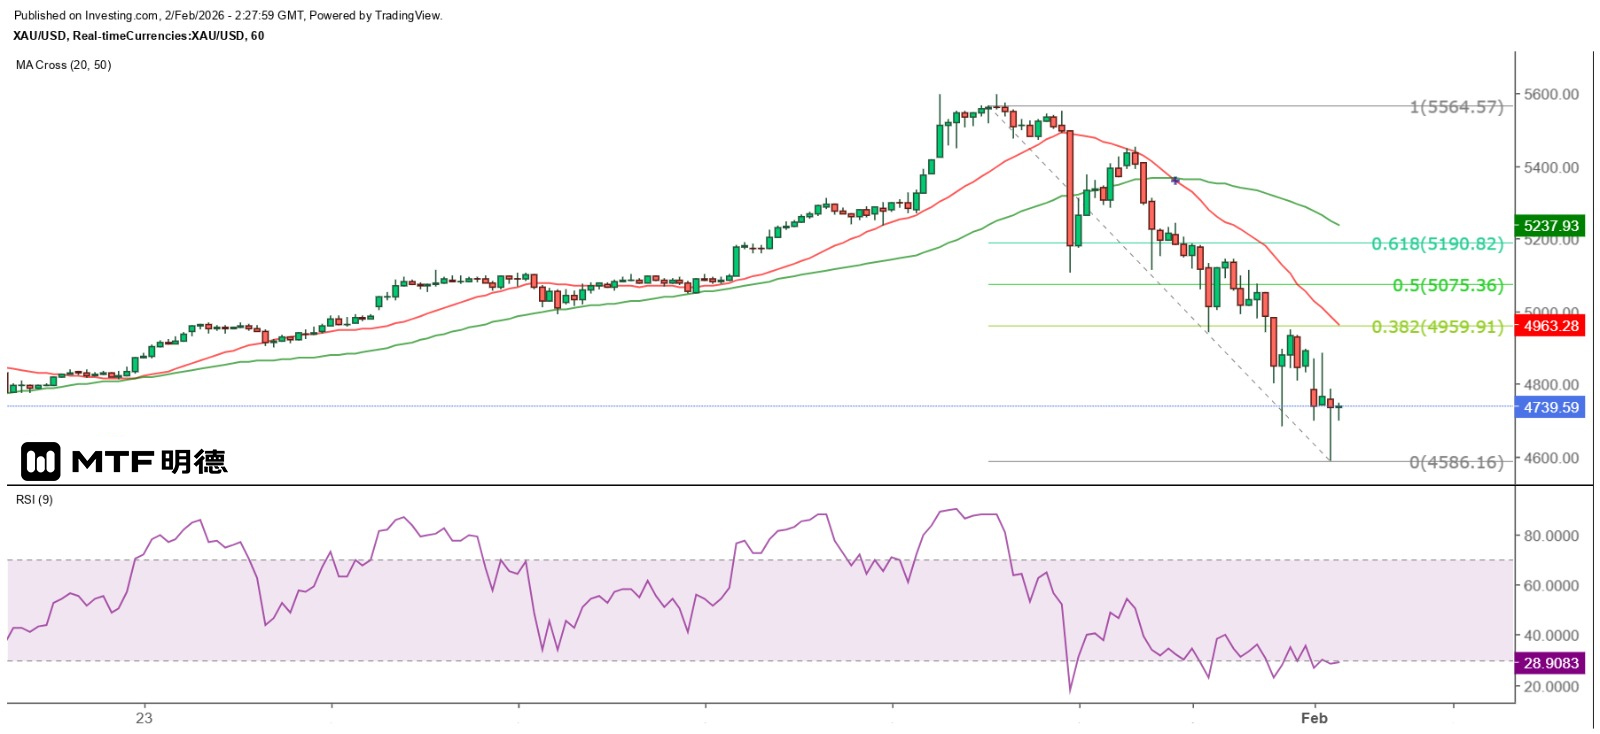
"Gold Price at $4,810 Likely to Be Resistance for Rebound" 2/2/2026 10:25 Completed Last Friday, the prices of gold and silver plunged sharply in a single day. Spot gold dropped by 530.5 US dollars, with the maximum decline reaching approximately 714 US dollars. Spot silver fell by nearly 21 US dollars, with the maximum decline approaching 32 US dollars. This was the day with the largest single-day depreciation in history. Technically, after this significant drop, the 9RSI overbought levels on the monthly charts of spot gold and silver slightly decreased to 87.7 and 93.7 respectively, but they still remained at severely overbought levels. From the daily chart, the spot gold price attempted to break through the 20SMA (currently around 4786) last Friday, while the spot silver price tried to break through the 50SMA (currently around 76.15). This morning, both gold and silver opened lower with gaps and then rebounded. The gold price fully filled the gap left by the decline and then dropped again, even breaking through the low point of last Friday and testing 4600 US dollars. It bottomed out at 4586.16 US dollars before gradually rebounding and temporarily rising back above the 4700 US dollar level. As for spot silver, although it opened lower with a gap this morning and fell, it did not break through the low point of last Friday. It rebounded in tandem with the gold price. Even when the gold price was still over 100 US dollars below the low point of the gap left by the decline on the daily chart, the silver price had already turned upward. This, of course, is related to the volatility of the silver price. At present, what investors most want to know is undoubtedly: Have gold and silver reached their peak? I can only say that there is room for a rebound, but it's hard to say that they won't fall further. Moreover, as I have pointed out, for products that use leverage and have high volatility, whether they have reached their peak (or bottom) is not that important. Not to mention using daily candlestick charts as a reference for buying and selling, even the risks generated by one-hour chart fluctuations cannot be borne. As seen from the 5-minute chart, the gold price has yet to recover the top of the large bearish candle at $4,766, but the trend is improving. Additionally, from the Gann Square perspective, the gold price has now broken through the strong resistance level of $4,660 at the horizontal angle. The next resistance level at a 45-degree angle is $4,810, while the larger resistance is at the 90-degree angle at $4,960. Therefore, it can also be understood that $5,000 once again becomes an important resistance level for the gold price. If the gold price continues to decline, the previous high of $4,550 will be the next important support level. As for the silver price, $88 is expected to be the first major resistance for the day, while $70 is expected to be the short-term important support level. The above content is for reference only and does not constitute investment advice.
2026-01-30
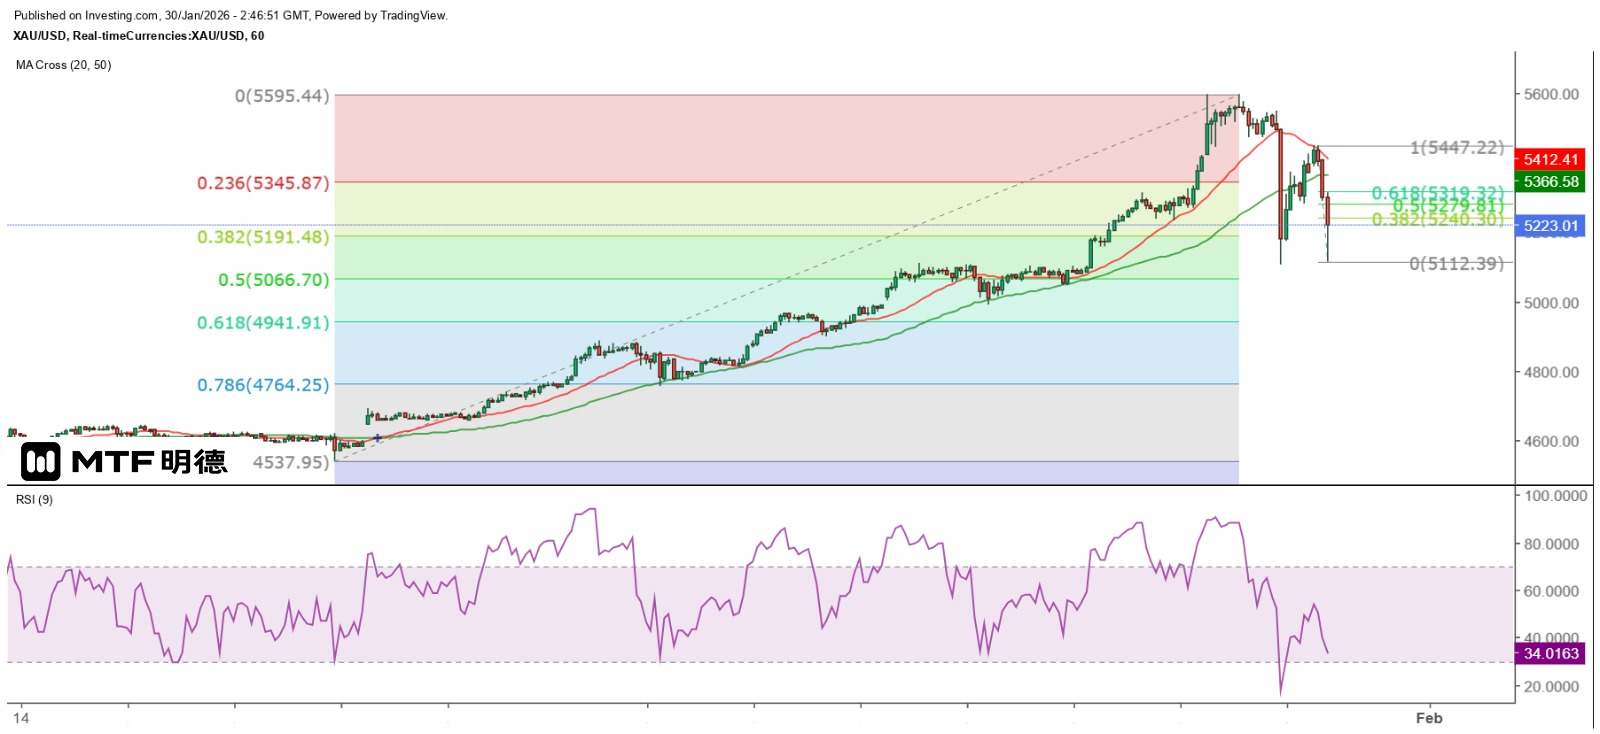
"Gold Price May Test $5,000 Before Stabilizing" 30/1/2026 10:45 Finalized Gold and silver witnessed a perfect storm yesterday. The spot gold price reached a high of $5,595.41 in the Asian market, then pulled back to a low of $5,446.64 before rebounding. It hit a new high of $5,595.44 in the early European market, although it formed a double top pattern. Subsequently, it dropped again. In the early New York market, the gold price started to fall from $5,549.48, and the decline was extremely sharp, hitting a low of $5,104.6, which means a single-day drop of nearly $491, the largest ever! Subsequently, the gold price began to rebound. From the hourly chart, it can be seen that the gold price slightly broke above the 20SMA (currently around 5408.2) in the early Asian session today, but then fell again, with a sharp decline, reaching a low of 5112.39 US dollars before starting a more substantial rebound. From a technical perspective, a double bottom pattern was formed at the 5100 US dollar level, and 5110 US dollars is the 135-degree angle of the Gann Square, which is a relatively strong support or resistance level. In other words, the gold price may temporarily stop falling and fluctuate above 5100 US dollars. However, the decline in the Asian session has been so strong that the possibility of a significant sell-off in the European and New York sessions is very high. Additionally, if the gold price breaks below 5100 US dollars, the stronger support level is at 4960 US dollars, and 5000 US dollars should be a key level for bulls to defend. Therefore, it is temporarily judged that the gold price can still fluctuate above 5000 US dollars. According to a report by the World Gold Council, last year, gold investment demand surged by 84% to 2,175.3 tons, but the amount of gold purchased by global central banks decreased by 21% to 863.3 tons. Analysts from the World Gold Council predict that this year, the amount of gold purchased by central banks may decrease by 200 to 250 tons compared to last year. Central banks have never been the main driving force behind the rise in gold prices; instead, it is investment demand. In other words, the two sharp drops in gold prices yesterday and this morning were likely caused by investors. Could it be that they are significantly reducing their holdings and then accumulating good positions at lower levels? However, I believe that the lowest point for today has not yet arrived. $5,280 is expected to be the first major resistance level for the day. If it falls below $5,100, it is likely to drop to $5,066 or $4,942 before stabilizing. The above content is for reference only and does not constitute investment advice.
2026-01-29
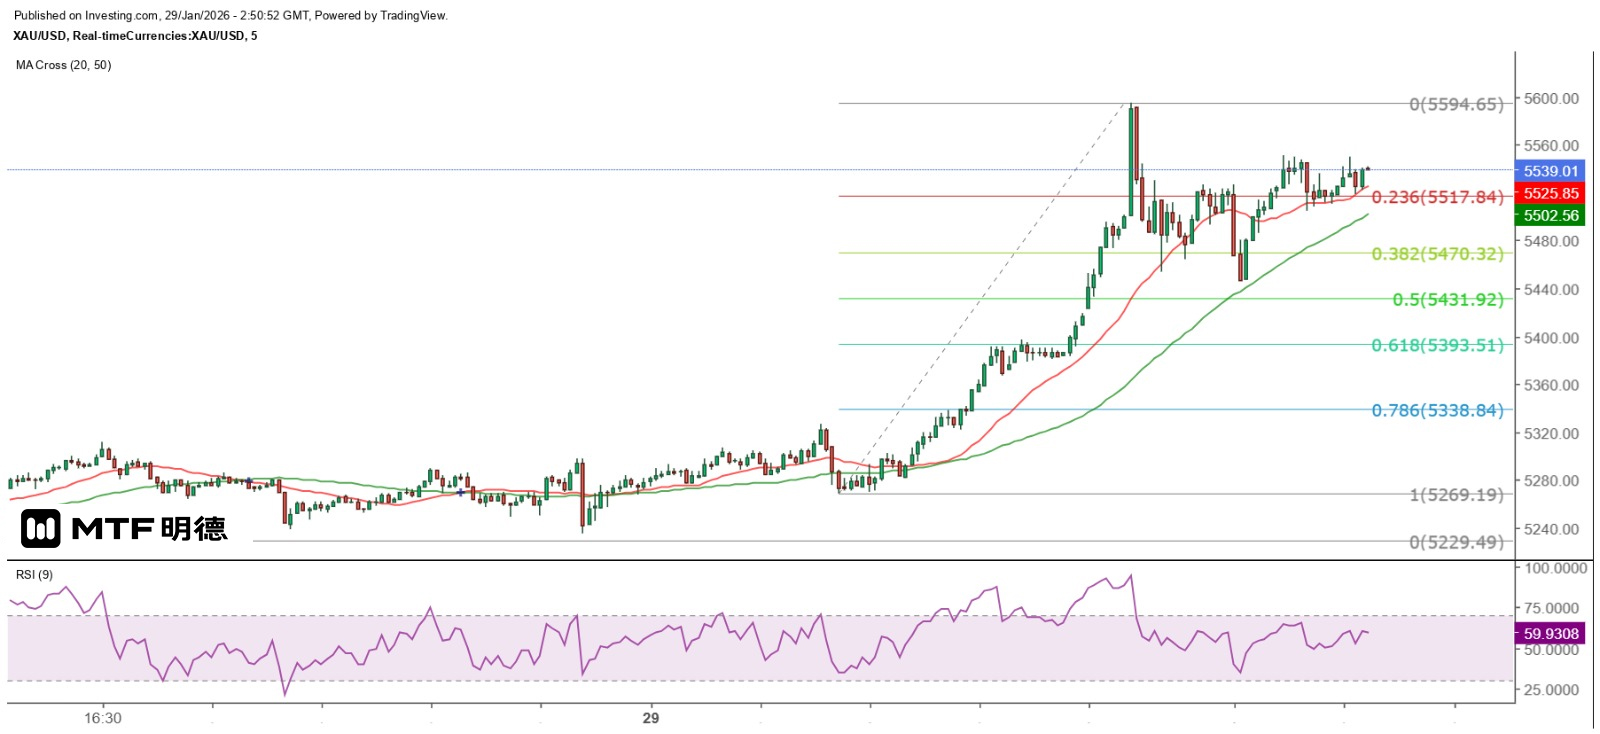
《金银离暴跌时间愈来愈近》29/1/2026 10:48 完稿 没有最疯狂,只有更疯狂!虽然昨天美国财长贝森特表示,美国仍然维持强美元政策,令一众非美货币及贵金属价急跌,现货金价一度急近62美元,现货银价急跌近3美元后反复下挫,最终低见110.52美元后逐步收复失地,其后更于纽约尾市双双破顶,再创新高,现时金银价格真的是「分分钟」破顶! 不过,更疯狂的是,金价在今早亚洲市曾高见5595.41美元,即由贝森特发言后所做的低位5253.47美元计,累积上升近342美元,甚有挟淡仓兼派货的末段味道!从月线图所见,现货金及现货价的9RSI已分别逾98及逾97.6,为历史性最超买的时间,这亦等于说,金银距离大暴跌的时间愈来愈近。 金银双双急升与联储局昨晚议息后宣布维持利率不变所推动,不过,主席鲍威尔表示,美国的通胀上行及劳动市场下行风险已经解除,目前处于有利位置,更表示现在没有委员的基本预测是下一步会加息,但最终他们会做认为正确的事。由于鲍威尔很大可能在5月份卸任主席后,亦不会留任理事一职,特朗普亦必然会换入相对鸽派的人接任联储局主席,而这亦是推动金价持续上升的主要原因。 现时从技术角度看,只能从1分钟或5分钟图表进行分析较实际,而20及50SMA仍然是主要的移动平均线支持。从5分钟图可见,今早金价的回调低位5446.64美元,仍然较50SMA高近10美元,换言之,现时的短线操作风险已大幅上升。现时5550美元为超短线阻力,从江恩正方形观察,5560美元位于270度垂直角,故属强阻力所在,下一级较具阻力的价位则为5710美元,支持位则为50SMA(现约5500),下一级较具支持的价位则为5410美元。 以上内容仅供参考,不构成投资建议。
2026-01-28
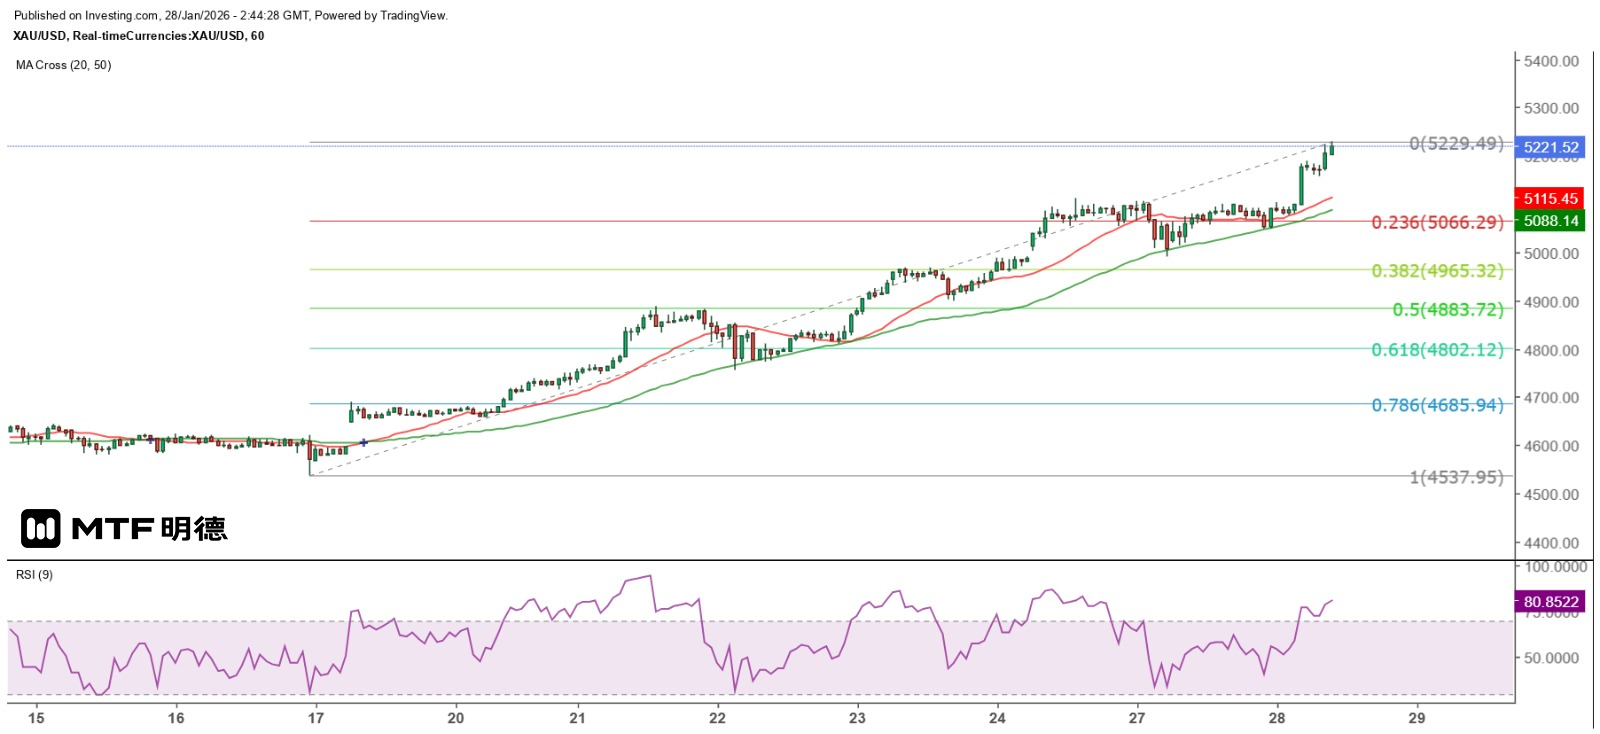
"Gold Price Faces Strong Resistance at $5,260 in the Short Term" 28/1/2026 10:43 Completed Yesterday, the spot gold price reached a high of $5,101.1 at the opening of the European market and then began to consolidate. In the early New York session, it twice fell to $5,047, where it found support and then climbed again. At the end of the session, it suddenly broke through its previous high and continued to rise, pushing the gold price to a record high of $5,190.56. Although it slightly pulled back later, the upward momentum did not wane. This morning, after the Asian market opened, the gold price resumed its upward trend, reaching a new record high of $5,224.77. In addition, non-US currencies also rose sharply. The euro reached as high as 1.2081 against the US dollar, the pound sterling reached as high as 1.3868 against the US dollar, and the US dollar fell as low as 152.10 against the Japanese yen. The market attributed the sudden weakening of the US dollar to Trump's statement that he was "not worried about the depreciation of the US dollar", which gave the market an excuse to further sell the US dollar in this turbulent global situation and the weak state of the US dollar. The sharp rise in gold prices and the breakthrough of 5200 US dollars were directly driven by the CME's decision to raise the margin requirements for silver futures contracts, while the margin requirements for gold contracts remained unchanged. This naturally led more funds that were selling or bearish on the US dollar to flow into the gold market. Currently, it can be seen that the financial market is increasingly influenced by human factors, lacking a solid foundation and tending to be irrational. This is often a sign of a bubble burst. However, given the current trend of gold prices, it is expected to maintain a fluctuating upward movement in the short term. Investors should follow the trend and not merely act on the "buy" signal, as a decline in gold prices can also create considerable profit opportunities. From the perspective of the hourly chart, the previous peak of $5,111.11 has become a strong support level for short-term adjustments, with the ultra-short-term support level at $5,210. If this level is held, it is expected to further challenge $5,260, where significant resistance is anticipated. The 50SMA on the hourly chart (currently at $5,088) is a key trend indicator. Once it is breached, it indicates a reversal of the upward trend since January 16th, and gold prices are expected to undergo a deeper adjustment. Based on the current range, it is expected to find support at $4,883.72. The above content is for reference only and does not constitute investment advice.
2026-01-27
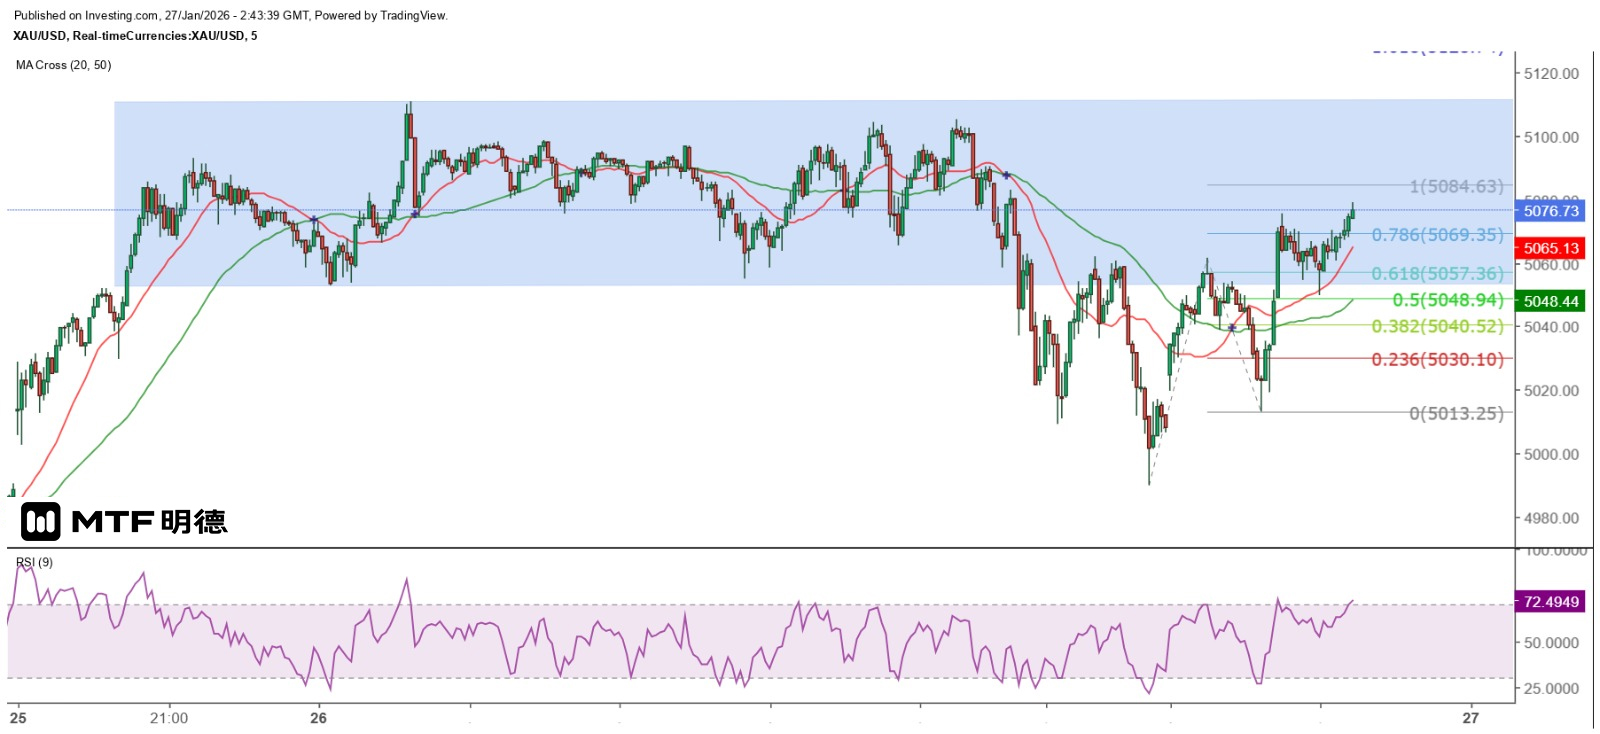
"Gold and Silver Prices Enter Consolidation Phase" 27/1/2026 10:42 Finalized The spot gold price movement yesterday was exactly as expected. It peaked at the $5,111 level and then started to fall. Although it remained largely sideways for most of the time, it began to weaken in the New York midday session and broke through the bottom of the sideways range. At the end of the trading day, it dropped to $4,990, precisely the bottom of the important support zone of $4,990 to $5,010 that was pointed out yesterday. Today, the gold price has been fluctuating upward, reaching a high of $5,075.57. From the 5-minute chart, it can be seen that this level is at the bottom of the tail end of yesterday's sideways range and is also close to the neckline of a small double top, thus indicating significant selling pressure. Measured by the Fibonacci extension line from the rise since $4,990, the current level has not yet reached 100% ($5,084.63). As the gold price touched both strong resistance and strong support yesterday, it is expected to fluctuate between $4,990 and $5,110 today. Taking $5,050 as the center, the resistance is at $5,080 and the support is at $5,020. Silver prices have shown significant volatility. As seen on the 5-minute chart, they have slightly exceeded the 100% Fibonacci extension level of 110.19. The highest point this morning was $111.11. The rebound from yesterday's low of $102.11 has also surpassed 50% of yesterday's maximum decline, which is $109.92. Therefore, it is expected that silver prices will encounter resistance between $110 and $112. The first support level for intraday adjustments is $107.90. From the daily chart, the prices of gold and silver both showed a shooting star pattern indicating a potential decline yesterday. The prices of gold and silver have risen rapidly in recent days. It is believed that they need to consolidate for a period of time before they can reach new highs. Therefore, it is expected that the gold price will remain above $5,000 in the short term, while the silver price is more likely to fluctuate above $110. The above content is for reference only and does not constitute investment advice.
2026-01-26
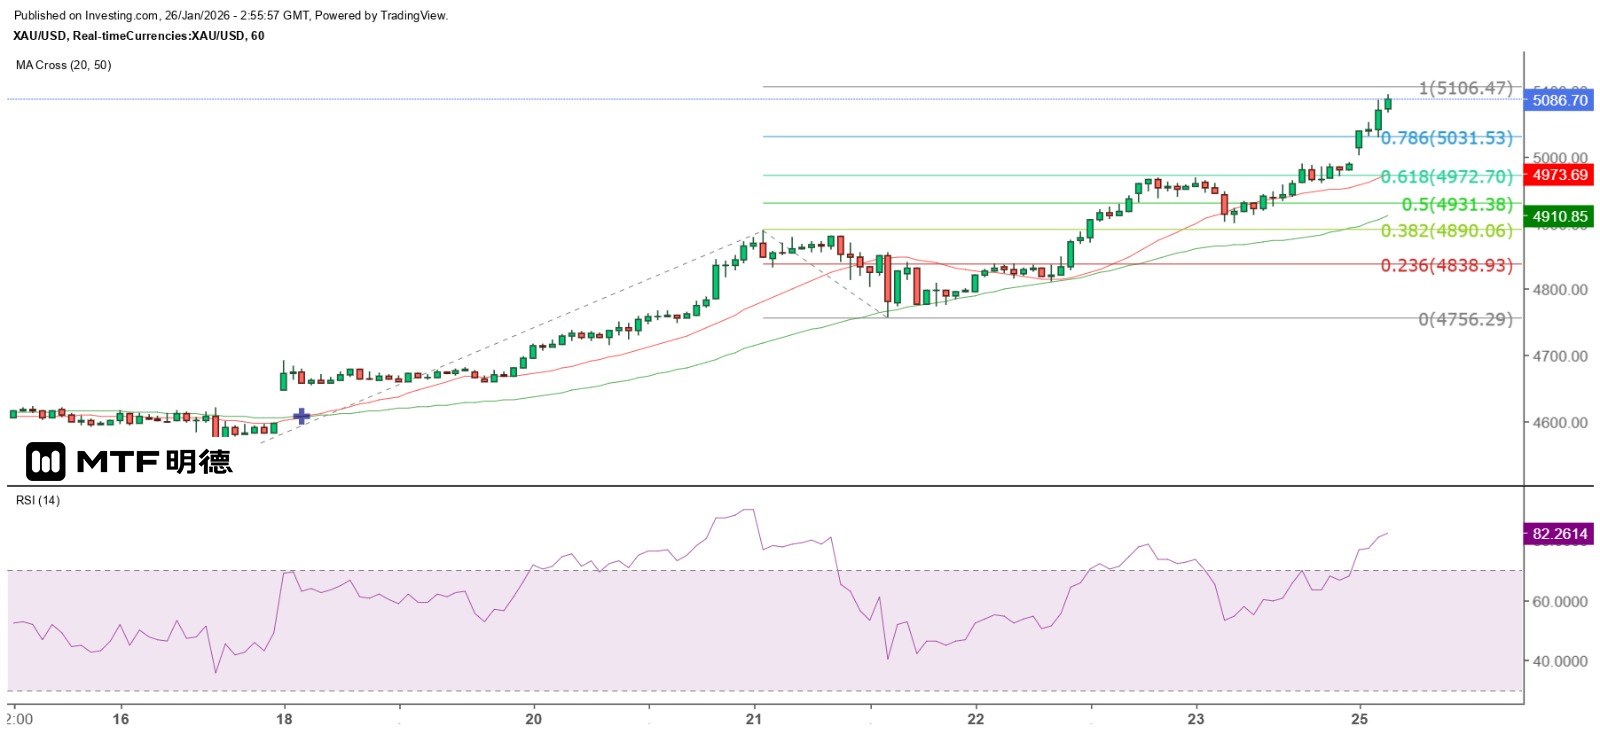
Gold price still faces short-term resistance at 5110. 26/1/2026 10:55 Completed Gold and silver prices continue to soar. After the spot gold price broke through the $5,000 mark this morning, it has continued to rise. After the strong resistance at $4,960 at the 90-degree angle of the Gann Square was broken, the gold price is inclined to further challenge the $5,110 at the 135-degree angle, which is the strong resistance level I pointed out. The performance of silver prices is even stronger. The $100 mark was easily broken, and it has already risen to $108 this morning, approaching $110. Recently, the market has been frantically snapping up physical silver as an investment tool without regard for price. I believe a bubble has formed. How it began will be how it ends. The prices of gold and silver will eventually plummet for several consecutive days to end this game. The quarterly charts of gold and silver futures prices show that the 9RSI has risen above 95. A sharp fall is expected as the rise and fall of gold and silver have completely deviated from the fundamentals and merely reflect the so-called geopolitical risks that could reverse at any time. I don't believe these geopolitical risks will lead to long-term and persistent conflicts, especially if they are all triggered by a Trump. Investors who have engaged in the "Trump Trade" should not follow too closely. Firstly, he himself will change his course according to the wind. Secondly, if the Republicans lose control of the House of Representatives in the midterm elections in November this year, the market situation is very likely to reverse. For now, the market can still hype up the dovish stance of the Fed's post-Powell monetary policy, thus selling off the US dollar. Meanwhile, the AI concept continues to drive up the US stock market, but the valuation is likely already too high and there is also a bubble risk. The current market situation is like a patient whose behavior has become abnormal, and is now looking for the cause of the illness. Eventually, he will recover. At present, the spot gold price is still rising towards the Fibonacci 100% extension level of $5,106.47 on the hourly chart. If $5,110 is also broken through, it is expected to further challenge the Gann 180-degree angle at $5,310. The $4,990 to $5,010 range is an important short-term support zone. For ultra-short-term trading, the 5SMA on the 5-minute chart (currently around $5,079) is an important support level. A close below this level can be regarded as a short-term reversal to the downside. At this stage, investors should not incorporate too many personal opinions. To make money, just follow the signals sent by the market and trade with the trend! The above content is for reference only and does not constitute investment advice.
2026-01-23
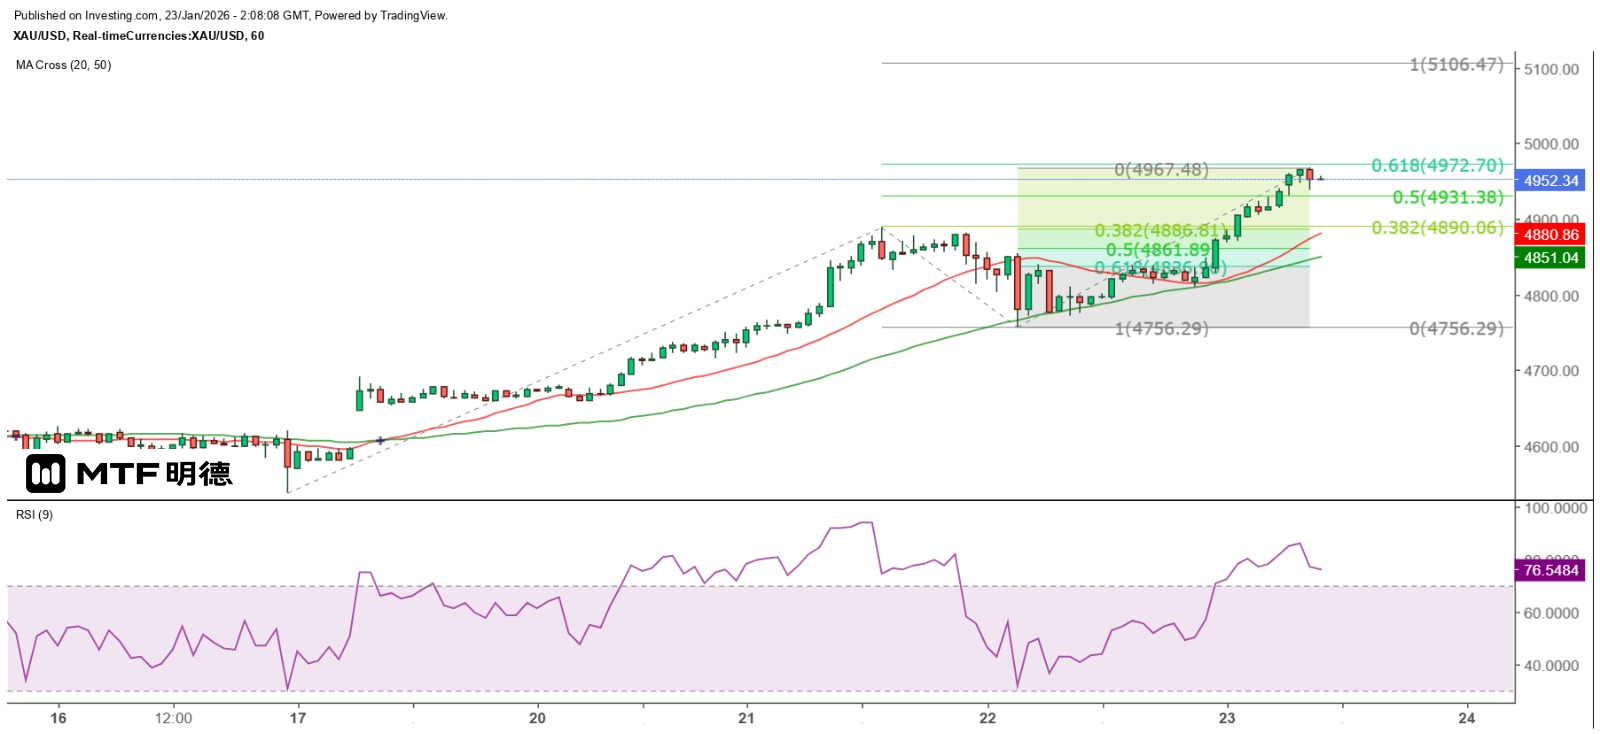
"Gold Price May Have Hit a Short-Term Peak" 23/1/2026 10:06 Completed Although Trump stated that the US would not use force to "possess" Greenland, and said that the US and NATO member states had reached a framework agreement on the strategic deployment of Greenland and the Arctic region, paving the way for a long-term agreement, it was reported that Greenland was even willing to cede a small piece of land to the US to build a military base. However, Denmark firmly stated that there was no room for discussion on the sovereignty of Greenland. Perhaps because no details of the agreement have been made public yet, and even if the Greenland factor is excluded, the Middle East issue and the monetary policy direction of the Federal Reserve after Powell have all become excuses for the market to push up the gold price. Spot gold prices continued to rise after breaking through the psychological threshold of $4,850 in the early morning of New York yesterday, and then surpassed $4,900, reaching a high of $4,940.81. Today, gold prices opened higher in the Asian market, reaching a high of $4,967.48 before encountering significant selling pressure, and dropped to a low of $4,937.39. Technically, gold prices have shown a bearish engulfing pattern on both the 5-minute and 1-hour charts. It was previously noted that $4,960, located at the 90-degree angle of the Gann grid, is a strong resistance level. This morning, gold prices slightly broke through this level but then rapidly fell back. Subsequently, they rebounded continuously, but have not yet been able to regain the $4,960 mark. The resistance at $5,100 for gold prices is huge. From the hourly chart, using the Fibonacci extension lines to measure the movement since January 16th, the high price of gold this morning has approached the 61.8% extension level at $4,972.7. Of course, this does not mean that the price of gold will definitely not rise further. Such calculations need to be made in advance by investors and used as part of their strategy to turn into profits. If the price of gold can break through the top and reach a new high, the next major resistance level is at the 135-degree angle at $5,110. If the price of gold reaches the 100% Fibonacci extension level, it could rise to $5,106.47. Therefore, it can be expected that the price of gold will encounter significant resistance above $5,100. Firstly, the gold price faces significant resistance at $4,960. Once it breaks through this level, it will encounter the psychological barrier of $5,000, which may entice the market to push it through. However, there is a risk of a rapid pullback after a break, and it is unlikely to surge directly to $5,110. If the gold price fails to reach a new high after the European market opens, it is likely that a short-term top has emerged. The first target for a test would be $4,900, followed by a test of support at $4,810. The $4,660 level, which is at the horizontal angle, appears to be a more supportive price at present. The above content is for reference only and does not constitute investment advice.
2026-01-22
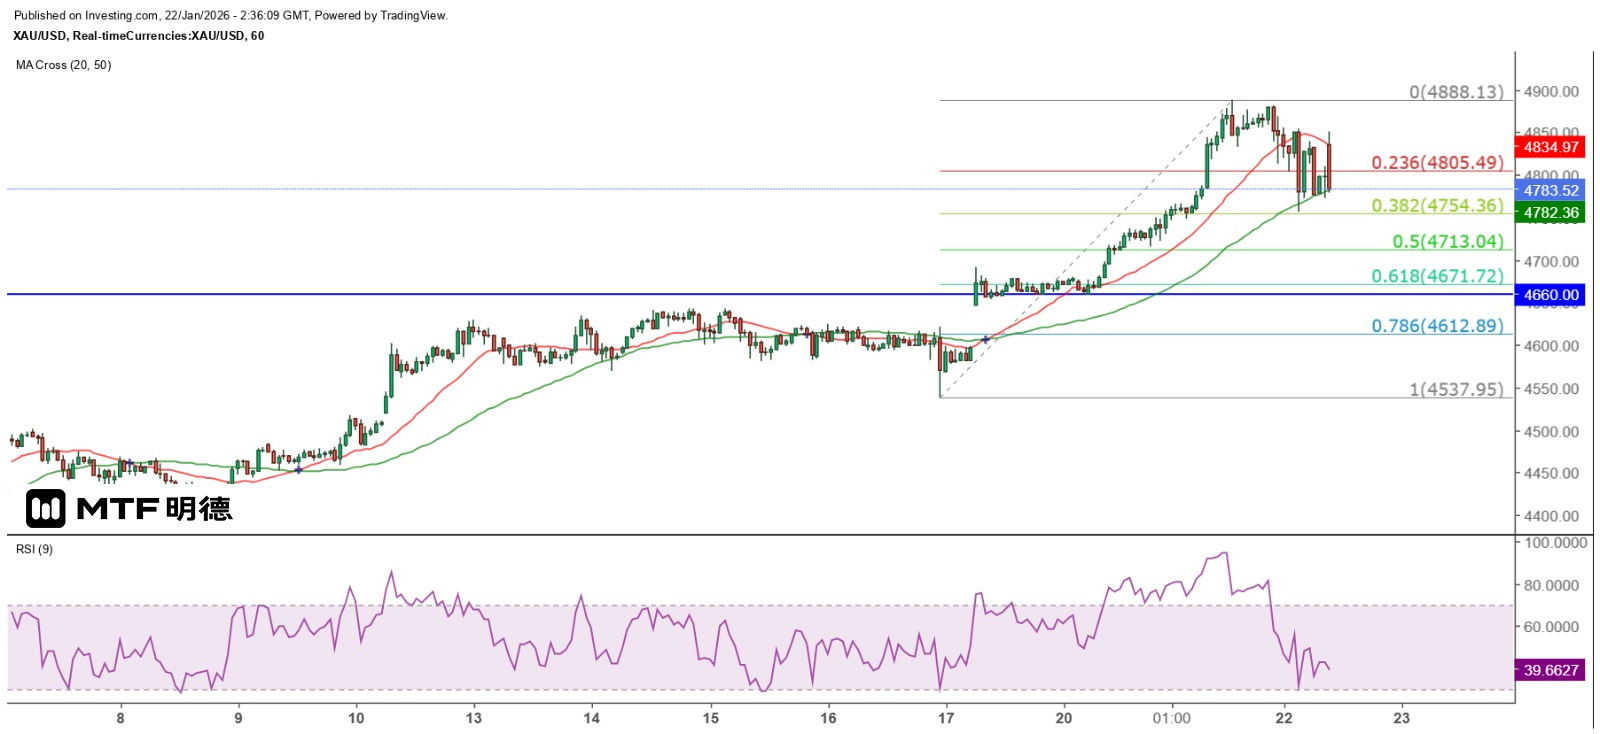
"Gold Price at $4,660 is a Key Support Level" 22/1/2026 10:33 Completed Trump said at the World Economic Forum in Davos on Wednesday that the United States has reached a framework for a future agreement with NATO on strategic deployment in Greenland and the Arctic region, and said that the implementation of the plan will bring huge benefits to the United States and NATO member states. In addition, he said that the United States would suspend the planned imposition of tariffs on eight European countries on February 1. At the same time, he said that the United States would not use force to occupy Greenland, and said that the United States has reached a framework for a future agreement on Greenland, and the United States will participate in the island's mining rights. It is reported that the agreement may involve Denmark ceding a small piece of land in Greenland to the United States to establish a military base. Trump's remarks sent US stocks soaring, while the prices of gold and silver plunged sharply due to the reduced so-called safe-haven demand. Yesterday, the spot gold price in New York City's late trading session dropped to $4,756.29, a decline of more than $132 from the $4,888.13 it reached in the early European trading session. After a rebound, the price was capped at $4,840 and then fell again, forming a narrowing triangle on the 5-minute chart. In the early Asian trading session today, the gold price still failed to rise above the $4,800 level. If we look at the timing, the gold price's rise this week was triggered by Trump's statement that he might use force to "own" Greenland, causing it to climb from below $4,700. Currently, this factor can be said to have vanished, and the gold price should fall back below $4,700, or even below $4,643. From the hourly chart, it can be seen that the spot gold price is currently trapped between the 20SMA (4835) and the 50SMA (4782), waiting for a breakthrough. From the Gann Square, the range of $4810 to $4860 has become a resistance zone. Currently, the gold price is fluctuating within the range of $4810 to $4760. Once it breaks below the 50SMA, the gold price will return to fluctuate within the range of $4710 to $4760, and the next important support level is $4660, which is also the bottom support of the horizontal range on Tuesday. I estimate that after the recent rapid rise driven by unexpected events, the possibility of a short-term pullback is very high, and $4660 can be regarded as an important support level for this pullback. The above content is for reference only and does not constitute investment advice.
2026-01-21
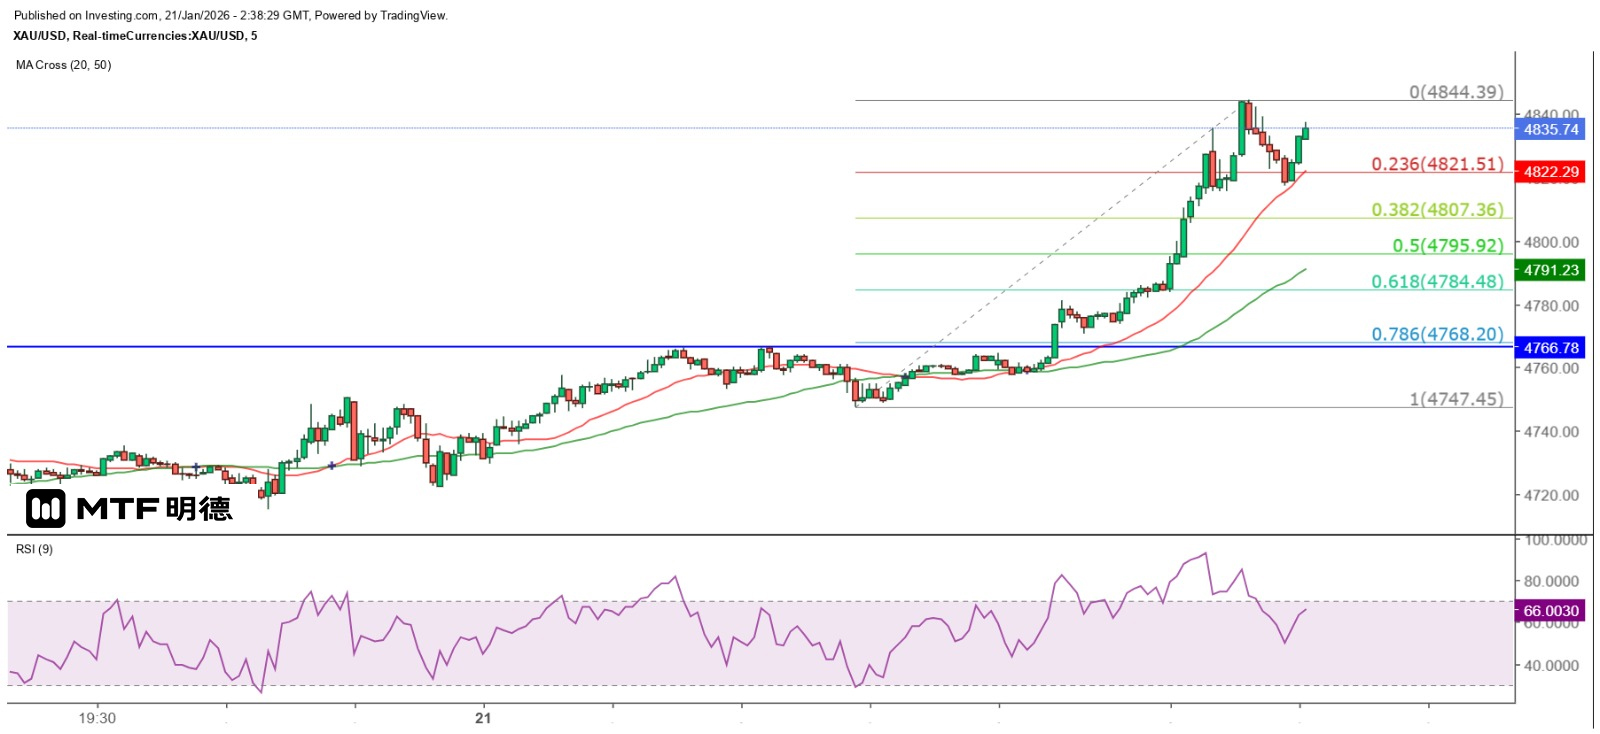
"Gold's main resistance is at $4,960" 21/1/2026 10:36 Finalized Trump insisted on "owning" Greenland and even threatened to impose tariffs on a number of European countries that opposed him, causing a sharp rise in risk aversion in the financial market. The purpose of gold prices consolidating at a high level on Monday this week has become apparent. Yesterday, the spot gold price broke through $4,700 in the midday Asian session before the opening of the European market, and then rose repeatedly, reaching a high of $4,373.75 near the midday European session. After that, a round of profit-taking selling emerged, and the price dropped to $4,715.45 in the early New York session, but then rose again and further reached a high of $4,750.49. From the 5-minute chart, after a sharp pullback, gold failed to break through $4,750 again and formed a small double top before retreating. However, it bottomed out at $4,722.57 and then formed a small double bottom to rebound. In the New York midday session, it twice rose to the $4,766 level and then formed a double top to fall back. It bottomed out at $4,747.45, slightly testing the previous double top before gradually recovering. Today, in the early Asian session, it resumed its upward trend, reaching a high of $4,844.39 before pulling back again. Technically, the recent pullbacks in gold prices have found strong support at the 20SMA (currently around $4,815) and 50SMA ($4,787) on the 5-minute chart. From the Gann Square perspective, $4,810 is located at a 45-degree angle, which is a minor resistance level. The major resistance level is at a 90-degree angle at $4,960. Given the current strength of gold prices, it is expected to challenge this level this week. However, I would like to remind investors that all sharp rises or falls in the prices of financial assets caused by non-economic factors will not last. The current focus is on Greenland. In fact, Trump's proposed leasing plan is one of the solutions. Besides, it is also feasible for Denmark to allow Greenland to become independent and a neutral country. Even in the worst-case scenario, if the United States and many European countries station troops in Greenland, it is not necessarily a bad thing. At least, this would ensure that Greenland is protected by all parties. It is also possible that this is a grand scheme jointly played by the United States and European countries! The above content is for reference only and does not constitute investment advice.
2026-01-20
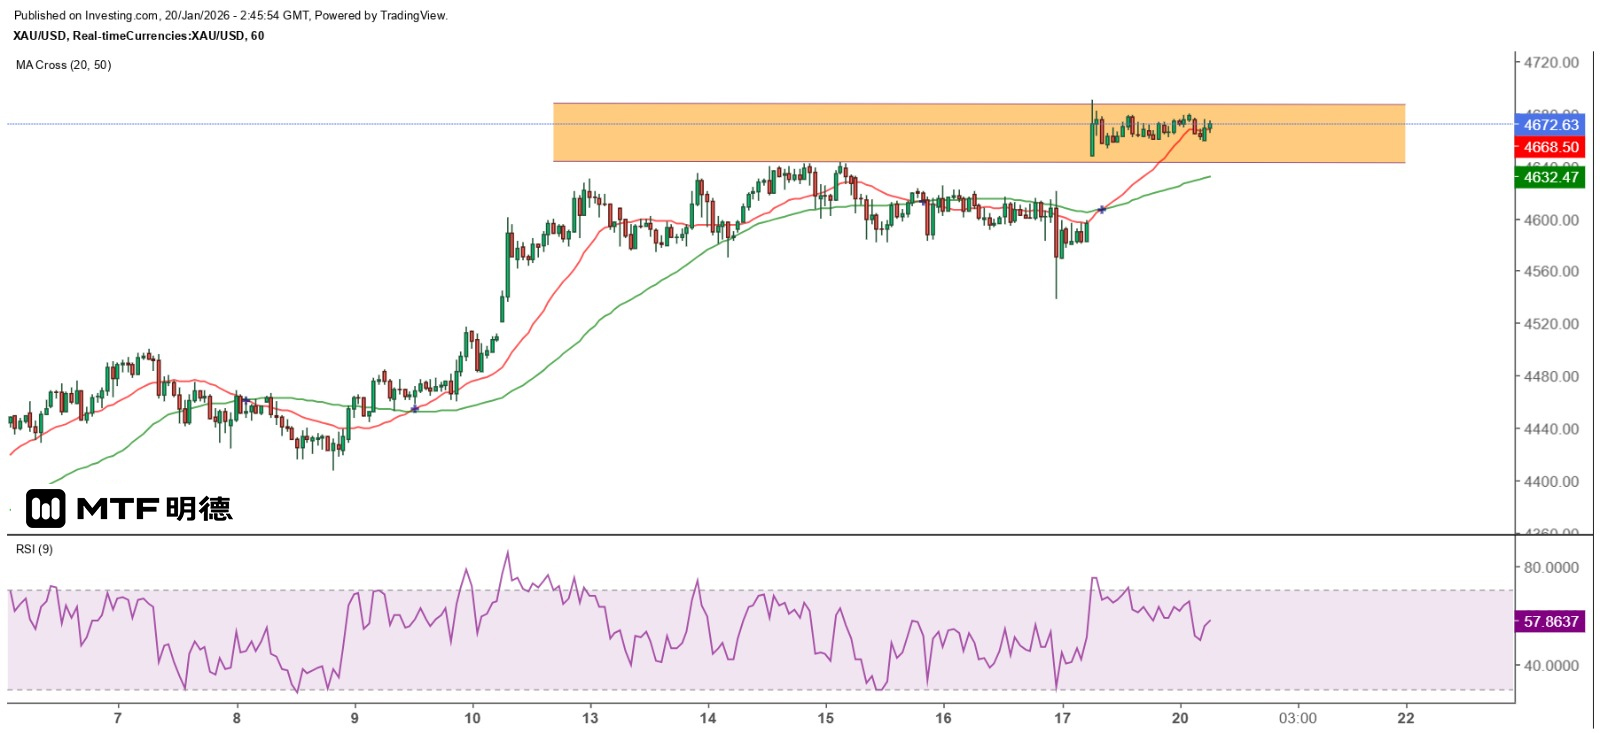
"Gold Price Expected to Break Record, Challenge $4,710" 20/1/2026 10:44 Completed After a gap-up yesterday, gold prices remained range-bound throughout the day. The high was still the opening high in Asia at $4,690.75, and no new record highs were set during the European and New York trading sessions. Today, the Asian session's low was exactly $4,660. The price then fluctuated upward, reaching a high of $4,676.15 before a sharp drop to a low of $4,666, after which it rebounded. Currently, the spot gold price is supported at $4,660 as the first level. If this level is breached on the hourly chart, the next level to watch is the gap low of $4,647.41 from yesterday. If this level is also breached on the hourly chart and cannot be re-established within a few hours, it can be judged that the sideways consolidation yesterday was a setup for a decline rather than an upward move. Therefore, I would like to remind investors again that the price movement on Monday often reflects factors not yet reflected in the price over the weekend, leading to a trend move. However, if there is no follow-through in the European session or even the New York session, after the relevant factors are digested, the price often reverses on Tuesday. At present, the gold price is still seen moving sideways within a range. The main strategy is to sell at the high and buy at the low. However, if the price breaks below the bottom of the sideways range (with 4660 as a reference) or above the top of the range (with 4680.34 as a reference), a new trend market may emerge. The top of last week at 4643.18 dollars is an important support level, as the price often tests the support at this level after breaking through the top. Currently, the gold price has once again challenged the top of the sideways range, and it is expected to break through upward within the day and challenge the next resistance at 4710 dollars. The above content is for reference only and does not constitute investment advice.
2026-01-19
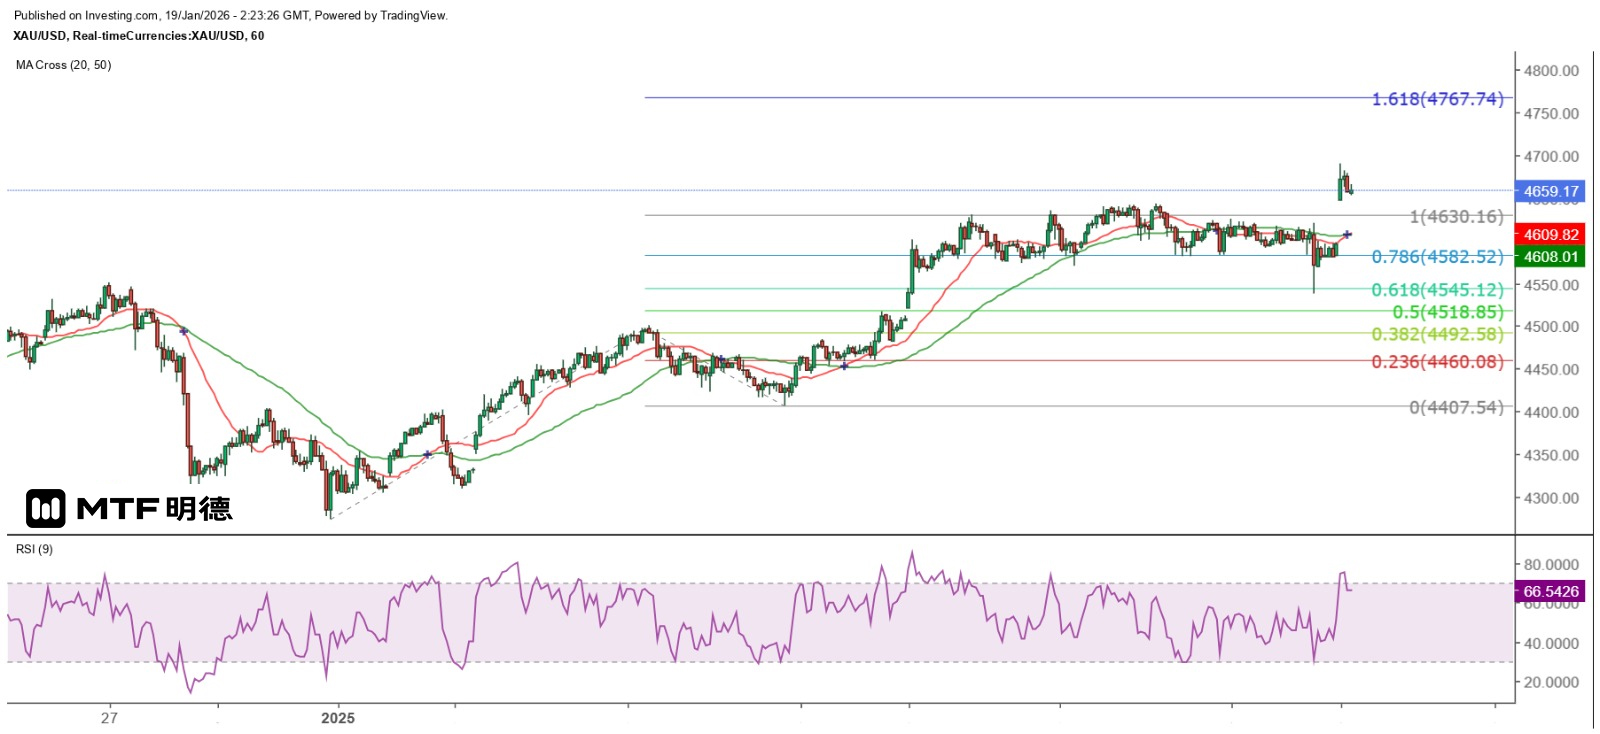
"Gold Price at $4,660 May Serve as Strong Support" 19/1/2026 10:22 Finalized Last Friday, the spot gold price was mostly trading between $4,590 and $4,620. It dropped sharply to $4,537.95 near the New York midday session, although it did not fall to the expected $4,510 before rebounding as predicted. The price then gradually recovered lost ground, but failed to close above $4,600. However, this morning in the Asian session, the gold price gapped higher and continued to rise, reaching a new historical high of $4,690.75. It then pulled back, hitting a low of $4,656.55 before stabilizing. The sharp rise in gold prices is believed to be related to Trump's threat to impose 10 to 15 percent tariffs on eight European countries. The reason is that these eight countries - Denmark, Norway, Sweden, France, Germany, the United Kingdom, the Netherlands and Finland - oppose his intention to purchase Greenland. The above tariffs will be implemented on February 1st, and Trump has also stated that the tariffs will be raised to 25% from June until a comprehensive and thorough agreement on the purchase of Greenland is reached. In other words, this implies that the United States will not seize Greenland by force, and the United States is also making some deployments during the negotiation period. If the United States and its European allies go to war over this, will Greenland be protected by multiple countries in a way? Spot gold prices broke through the top resistance of the sideways range of $4,643.18 on the hourly chart since January 12th, making this level very likely to become a strong support for short-term adjustments. Additionally, gold prices also broke through the Gann Square horizontal angle at $4,660, which is a highly significant signal. This indicates that gold has found a higher support level, and the next major resistance level is expected to be at $4,810. The possibility of a short-term challenge to $4,700 is extremely high, and it is more likely to challenge the 1.618 Fibonacci extension level of $4,767.74 on the hourly chart before a larger adjustment occurs. The above content is for reference only and does not constitute investment advice.


