
 en-US
en-US 

 Telegram
 WeChat


2025-08-18
"Gold Weakness Expected to Persist Through Next Week" 15/8/2025 9:53 Completed Yesterday, the US Department of Labor released the Producer Price Index (PPI) for July. Both the overall and core PPI rose by 3.3% and 3.7% year-on-year, significantly higher than the 2.4% and 2.6% increases in June. The monthly increase was 0.9% for both, compared to no change in June. The data dampened investors' expectations of a rate cut by the Federal Reserve in September, but interest rate futures indicate that the probability of a rate cut still exceeds 90%, suggesting that the chance of a rate cut in September remains high. San Francisco Fed President Daly stated that he opposes a 50 basis point rate cut in September, arguing that it would send an emergency signal and show a lack of confidence in the strength of the labor market. From another perspective, he has not changed his stance in support of a rate cut in September. The chances of the Federal Reserve cutting interest rates in September remain high. Although PPI is regarded as a leading indicator of inflation, there are certain differences between PPI and CPI in terms of the categories of prices collected and the collection time. Therefore, it is not surprising to see a deviation between the two. Of course, it is normal for the market to have a strong reaction to effectively manage risks. As a result, US stocks fell, the US dollar exchange rate and US bond yields rose. However, as the market still expects a 90% probability of a rate cut in September, the data did not change the market's view on a rate cut in September. The intraday decline target is $3,297. Gold prices were under pressure. By the end of the New York midday session yesterday, the spot gold price had once dropped below $3,330, further confirming that $3,370 has become a short-term resistance level. Yesterday, the gold price again presented a piercing pattern on the daily chart, indicating that the top near $3,375 yesterday has become a new resistance level. If the closing price today is below $3,345, the gold price will show a bearish signal on the weekly chart, and in the worst case, the weakness will continue for most of next week. This morning, the gold price hit a low of $3,332 before rebounding and once again rose above $3,340. In the short term, using the Fibonacci extension line to measure the movement since August 8th, if it reaches 100%, the gold price will fall to $3,297, which is also today's downside target. A rebound within the day is expected to face significant resistance at $3,352. The above content is for reference only and does not constitute investment advice. MTF Special Analyst Zheng Guangfu

2025-08-18
"Gold Weakness Expected to Persist Through Next Week" 15/8/2025 9:53 Completed Yesterday, the US Department of Labor released the Producer Price Index (PPI) for July. Both the overall and core PPI rose by 3.3% and 3.7% year-on-year, significantly higher than the 2.4% and 2.6% increases in June. The monthly increase was 0.9% for both, compared to no change in June. The data dampened investors' expectations of a rate cut by the Federal Reserve in September, but interest rate futures indicate that the probability of a rate cut still exceeds 90%, suggesting that the chance of a rate cut in September remains high. San Francisco Fed President Daly stated that he opposes a 50 basis point rate cut in September, arguing that it would send an emergency signal and show a lack of confidence in the strength of the labor market. From another perspective, he has not changed his stance in support of a rate cut in September. The chances of the Federal Reserve cutting interest rates in September remain high. Although PPI is regarded as a leading indicator of inflation, there are certain differences between PPI and CPI in terms of the categories of prices collected and the collection time. Therefore, it is not surprising to see a deviation between the two. Of course, it is normal for the market to have a strong reaction to effectively manage risks. As a result, US stocks fell, the US dollar exchange rate and US bond yields rose. However, as the market still expects a 90% probability of a rate cut in September, the data did not change the market's view on a rate cut in September. The intraday decline target is $3,297. Gold prices were under pressure. By the end of the New York midday session yesterday, the spot gold price had once dropped below $3,330, further confirming that $3,370 has become a short-term resistance level. Yesterday, the gold price again presented a piercing pattern on the daily chart, indicating that the top near $3,375 yesterday has become a new resistance level. If the closing price today is below $3,345, the gold price will show a bearish signal on the weekly chart, and in the worst case, the weakness will continue for most of next week. This morning, the gold price hit a low of $3,332 before rebounding and once again rose above $3,340. In the short term, using the Fibonacci extension line to measure the movement since August 8th, if it reaches 100%, the gold price will fall to $3,297, which is also today's downside target. A rebound within the day is expected to face significant resistance at $3,352. The above content is for reference only and does not constitute investment advice. MTF Special Analyst Zheng Guangfu
2025-08-18
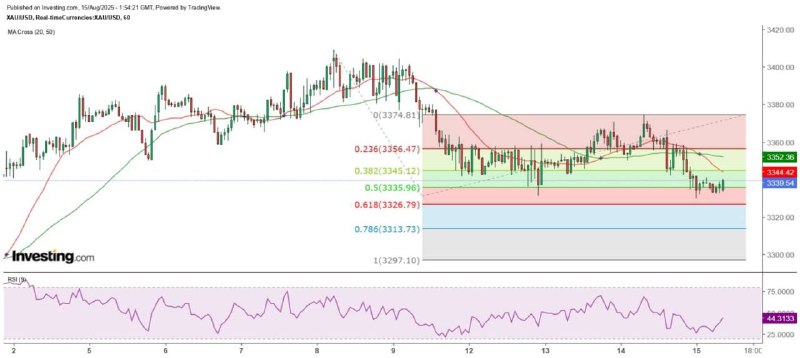
"Gold Weakness Expected to Persist Through Next Week" 15/8/2025 9:53 Completed Yesterday, the US Department of Labor released the Producer Price Index (PPI) for July. Both the overall and core PPI rose by 3.3% and 3.7% year-on-year, significantly higher than the 2.4% and 2.6% increases in June. The monthly increase was 0.9% for both, compared to no change in June. The data dampened investors' expectations of a rate cut by the Federal Reserve in September, but interest rate futures indicate that the probability of a rate cut still exceeds 90%, suggesting that the chance of a rate cut in September remains high. San Francisco Fed President Daly stated that he opposes a 50 basis point rate cut in September, arguing that it would send an emergency signal and show a lack of confidence in the strength of the labor market. From another perspective, he has not changed his stance in support of a rate cut in September. The chances of the Federal Reserve cutting interest rates in September remain high. Although PPI is regarded as a leading indicator of inflation, there are certain differences between PPI and CPI in terms of the categories of prices collected and the collection time. Therefore, it is not surprising to see a deviation between the two. Of course, it is normal for the market to have a strong reaction to effectively manage risks. As a result, US stocks fell, the US dollar exchange rate and US bond yields rose. However, as the market still expects a 90% probability of a rate cut in September, the data did not change the market's view on a rate cut in September. The intraday decline target is $3,297. Gold prices were under pressure. By the end of the New York midday session yesterday, the spot gold price had once dropped below $3,330, further confirming that $3,370 has become a short-term resistance level. Yesterday, the gold price again presented a piercing pattern on the daily chart, indicating that the top near $3,375 yesterday has become a new resistance level. If the closing price today is below $3,345, the gold price will show a bearish signal on the weekly chart, and in the worst case, the weakness will continue for most of next week. This morning, the gold price hit a low of $3,332 before rebounding and once again rose above $3,340. In the short term, using the Fibonacci extension line to measure the movement since August 8th, if it reaches 100%, the gold price will fall to $3,297, which is also today's downside target. A rebound within the day is expected to face significant resistance at $3,352. The above content is for reference only and does not constitute investment advice. MTF Special Analyst Zheng Guangfu

2025-08-15
"Gold Prices Form a Short-Term Descending Flag Pattern" 14/8/2025 10:00 AM Completed Trump's intention to replace the chairperson of the Federal Reserve is evident. Yesterday, he reiterated that the federal funds rate has dropped to 1%, and Treasury Secretary Mnuchin echoed his sentiment, suggesting that the Federal Reserve might cut interest rates by 50 basis points (presumably at the September meeting). Additionally, regarding the next chairperson of the Federal Reserve, he stated that there are 10 to 11 candidates to replace Powell, whose term ends in May next year. Although Powell could still serve as a Federal Reserve governor, if he is not reappointed as the chairperson, it is believed that he will also resign from the position of governor. Current interest rate futures indicate that the probability of a 25 basis point rate cut in September is 99.9%, and the chance of another 25 basis point cut in October exceeds 70%, with a nearly 60% probability of a further 25 basis point reduction in December. However, the Federal Reserve is unlikely to cut rates by half a percentage point in September. Although non-farm payrolls increased by only 74,000 in July, they still rose rather than fell, and the U.S. stock market has continued to reach new highs. Therefore, the Federal Reserve has no reason to make a significant half-percentage-point rate cut. Yesterday, the spot gold price rose to the $3,370 level at the beginning of the US stock market opening, but then fluctuated and fell repeatedly. $3,370 was exactly the 50% retracement level of the biggest decline since August 8th. It was originally thought that after the gold price broke through $3,360, the upward trend could continue to the 61.8% retracement level near $3,380. However, the gold price yesterday showed a narrow range of fluctuations and oscillations, indicating that the gold price is still in a downtrend. Be cautious of a sudden drop in gold prices within the trading day. However, investors should note that gold prices dropped sharply on Monday with a large bearish candle, and on Tuesday, after testing the lower levels, they rebounded on the same day to close. But the cumulative rebound was only slightly more than half, indicating that the bears still dominate the gold price trend. In the early Asian session today, gold prices again attempted to break through the $3,370 level. Although the high approached $3,375, it still closed lower at the $3,369 level on the hourly chart. Preliminary judgment suggests that the gold price is forming a descending flag pattern. If so, it will gradually rise in the short term and may even challenge the $3,380 or $3,392 levels. However, it is unlikely to break through the resistance level of $3,405, which was set by the large bearish candle on Monday. Subsequently, the gold price is expected to sharply reverse and fall again with a large bearish candle, targeting the $3,300 mark. Conversely, if the gold price fails to break through and hold above $3,370 today, or if it challenges $3,380 but closes lower with a bearish engulfing candle on the hourly chart, then the gold price is likely to test $3,320 and $3,300 within the day. The above content is for reference only and does not constitute investment advice. MTF Special Analyst Zheng Guangfu

2025-08-15
"Gold Prices Form a Short-Term Descending Flag Pattern" 14/8/2025 10:00 AM Completed Trump's intention to replace the chairperson of the Federal Reserve is evident. Yesterday, he reiterated that the federal funds rate has dropped to 1%, and Treasury Secretary Mnuchin echoed his sentiment, suggesting that the Federal Reserve might cut interest rates by 50 basis points (presumably at the September meeting). Additionally, regarding the next chairperson of the Federal Reserve, he stated that there are 10 to 11 candidates to replace Powell, whose term ends in May next year. Although Powell could still serve as a Federal Reserve governor, if he is not reappointed as the chairperson, it is believed that he will also resign from the position of governor. Current interest rate futures indicate that the probability of a 25 basis point rate cut in September is 99.9%, and the chance of another 25 basis point cut in October exceeds 70%, with a nearly 60% probability of a further 25 basis point reduction in December. However, the Federal Reserve is unlikely to cut rates by half a percentage point in September. Although non-farm payrolls increased by only 74,000 in July, they still rose rather than fell, and the U.S. stock market has continued to reach new highs. Therefore, the Federal Reserve has no reason to make a significant half-percentage-point rate cut. Yesterday, the spot gold price rose to the $3,370 level at the beginning of the US stock market opening, but then fluctuated and fell repeatedly. $3,370 was exactly the 50% retracement level of the biggest decline since August 8th. It was originally thought that after the gold price broke through $3,360, the upward trend could continue to the 61.8% retracement level near $3,380. However, the gold price yesterday showed a narrow range of fluctuations and oscillations, indicating that the gold price is still in a downtrend. Be cautious of a sudden drop in gold prices within the trading day. However, investors should note that gold prices dropped sharply on Monday with a large bearish candle, and on Tuesday, after testing the lower levels, they rebounded on the same day to close. But the cumulative rebound was only slightly more than half, indicating that the bears still dominate the gold price trend. In the early Asian session today, gold prices again attempted to break through the $3,370 level. Although the high approached $3,375, it still closed lower at the $3,369 level on the hourly chart. Preliminary judgment suggests that the gold price is forming a descending flag pattern. If so, it will gradually rise in the short term and may even challenge the $3,380 or $3,392 levels. However, it is unlikely to break through the resistance level of $3,405, which was set by the large bearish candle on Monday. Subsequently, the gold price is expected to sharply reverse and fall again with a large bearish candle, targeting the $3,300 mark. Conversely, if the gold price fails to break through and hold above $3,370 today, or if it challenges $3,380 but closes lower with a bearish engulfing candle on the hourly chart, then the gold price is likely to test $3,320 and $3,300 within the day. The above content is for reference only and does not constitute investment advice. MTF Special Analyst Zheng Guangfu
2025-08-15
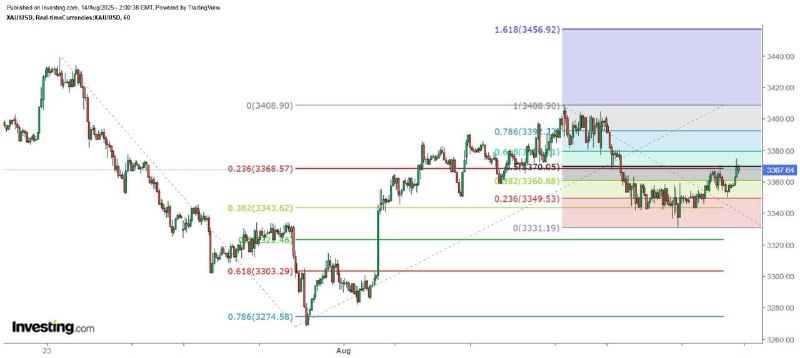
"Gold Prices Form a Short-Term Descending Flag Pattern" 14/8/2025 10:00 AM Completed Trump's intention to replace the chairperson of the Federal Reserve is evident. Yesterday, he reiterated that the federal funds rate has dropped to 1%, and Treasury Secretary Mnuchin echoed his sentiment, suggesting that the Federal Reserve might cut interest rates by 50 basis points (presumably at the September meeting). Additionally, regarding the next chairperson of the Federal Reserve, he stated that there are 10 to 11 candidates to replace Powell, whose term ends in May next year. Although Powell could still serve as a Federal Reserve governor, if he is not reappointed as the chairperson, it is believed that he will also resign from the position of governor. Current interest rate futures indicate that the probability of a 25 basis point rate cut in September is 99.9%, and the chance of another 25 basis point cut in October exceeds 70%, with a nearly 60% probability of a further 25 basis point reduction in December. However, the Federal Reserve is unlikely to cut rates by half a percentage point in September. Although non-farm payrolls increased by only 74,000 in July, they still rose rather than fell, and the U.S. stock market has continued to reach new highs. Therefore, the Federal Reserve has no reason to make a significant half-percentage-point rate cut. Yesterday, the spot gold price rose to the $3,370 level at the beginning of the US stock market opening, but then fluctuated and fell repeatedly. $3,370 was exactly the 50% retracement level of the biggest decline since August 8th. It was originally thought that after the gold price broke through $3,360, the upward trend could continue to the 61.8% retracement level near $3,380. However, the gold price yesterday showed a narrow range of fluctuations and oscillations, indicating that the gold price is still in a downtrend. Be cautious of a sudden drop in gold prices within the trading day. However, investors should note that gold prices dropped sharply on Monday with a large bearish candle, and on Tuesday, after testing the lower levels, they rebounded on the same day to close. But the cumulative rebound was only slightly more than half, indicating that the bears still dominate the gold price trend. In the early Asian session today, gold prices again attempted to break through the $3,370 level. Although the high approached $3,375, it still closed lower at the $3,369 level on the hourly chart. Preliminary judgment suggests that the gold price is forming a descending flag pattern. If so, it will gradually rise in the short term and may even challenge the $3,380 or $3,392 levels. However, it is unlikely to break through the resistance level of $3,405, which was set by the large bearish candle on Monday. Subsequently, the gold price is expected to sharply reverse and fall again with a large bearish candle, targeting the $3,300 mark. Conversely, if the gold price fails to break through and hold above $3,370 today, or if it challenges $3,380 but closes lower with a bearish engulfing candle on the hourly chart, then the gold price is likely to test $3,320 and $3,300 within the day. The above content is for reference only and does not constitute investment advice. MTF Special Analyst Zheng Guangfu

2025-08-14
Gold prices are expected to rebound intraday. 13/8 10:06 am Finalized Yesterday, the US Department of Labor released the July CPI. The overall year-on-year increase remained at 2.7%, while the core CPI's year-on-year increase expanded from 2.9% to 3.1%. One of the reasons was that energy item prices dropped by 1.6% year-on-year. As for the monthly performance, the overall CPI increase slowed from 0.3% to 0.2%, with energy prices falling by 1.1% month-on-month. The core CPI, on the other hand, expanded from 0.2% to 0.3%. Investors interpreted the data in their own ways. US stock investors believed that the data increased the chances of a rate cut in September, and the three major US stock indexes opened higher. Currency traders also focused on the overall CPI performance. As the increase was lower than expected, non-US currencies rose sharply. The USD/JPY pair dropped sharply from the intraday high of 148.52 to 147.86. The EUR/USD pair also rose to 1.1668, and the GBP/USD pair rose to 1.3510. However, the US 10-year bond yield plunged to 4.235% and then rebounded to 4.328%, the highest since August 5. US inflation eases, putting pressure on gold prices Moreover, the easing of inflation has weakened gold's anti-inflationary role, putting pressure on the gold price. It has repeatedly challenged the $3,358 level but failed each time, instead frequently falling below $3,340, with the lowest point reaching $3,331. This raises concerns that even if the Federal Reserve does cut interest rates in September, the gold price may not benefit. From an hourly chart perspective, after the spot gold price broke through $3,360 on Monday of this week, it has generally moved sideways, but the trend has been extremely volatile, reflecting a fierce battle between bulls and bears. 3380 is the biggest resistance for the current market. For the time being, it is expected that the gold price will fluctuate above $3,340 within the day. This morning, the gold price has broken through the downtrend line on the hourly chart, and it is an effective breakthrough. The measured upward target is approximately $3,378, which is close to the 61.8% retracement level of the largest decline since last Thursday at $3,379. However, the $3,360 level is exactly the 38.2% retracement level, and the gold price will encounter double resistance when it rebounds to this level. If it fails to break through and regain momentum, it indicates a weak trend in the gold price. Therefore, it is expected that the gold price will fluctuate between $3,340 and $3,360 within the day. The maximum resistance for an upward breakthrough is $3,380. If it breaks below the extended support of the ascending trend line at $3,344, the measured downward target is $3,317. The above content is for reference only and does not constitute investment advice. MTF Special Analyst Zheng Guangfu

2025-08-14
Gold prices are expected to rebound intraday. 13/8 10:06 am Finalized Yesterday, the US Department of Labor released the July CPI. The overall year-on-year increase remained at 2.7%, while the core CPI's year-on-year increase expanded from 2.9% to 3.1%. One of the reasons was that energy item prices dropped by 1.6% year-on-year. As for the monthly performance, the overall CPI increase slowed from 0.3% to 0.2%, with energy prices falling by 1.1% month-on-month. The core CPI, on the other hand, expanded from 0.2% to 0.3%. Investors interpreted the data in their own ways. US stock investors believed that the data increased the chances of a rate cut in September, and the three major US stock indexes opened higher. Currency traders also focused on the overall CPI performance. As the increase was lower than expected, non-US currencies rose sharply. The USD/JPY pair dropped sharply from the intraday high of 148.52 to 147.86. The EUR/USD pair also rose to 1.1668, and the GBP/USD pair rose to 1.3510. However, the US 10-year bond yield plunged to 4.235% and then rebounded to 4.328%, the highest since August 5. US inflation eases, putting pressure on gold prices Moreover, the easing of inflation has weakened gold's anti-inflationary role, putting pressure on the gold price. It has repeatedly challenged the $3,358 level but failed each time, instead frequently falling below $3,340, with the lowest point reaching $3,331. This raises concerns that even if the Federal Reserve does cut interest rates in September, the gold price may not benefit. From an hourly chart perspective, after the spot gold price broke through $3,360 on Monday of this week, it has generally moved sideways, but the trend has been extremely volatile, reflecting a fierce battle between bulls and bears. 3380 is the biggest resistance for the current market. For the time being, it is expected that the gold price will fluctuate above $3,340 within the day. This morning, the gold price has broken through the downtrend line on the hourly chart, and it is an effective breakthrough. The measured upward target is approximately $3,378, which is close to the 61.8% retracement level of the largest decline since last Thursday at $3,379. However, the $3,360 level is exactly the 38.2% retracement level, and the gold price will encounter double resistance when it rebounds to this level. If it fails to break through and regain momentum, it indicates a weak trend in the gold price. Therefore, it is expected that the gold price will fluctuate between $3,340 and $3,360 within the day. The maximum resistance for an upward breakthrough is $3,380. If it breaks below the extended support of the ascending trend line at $3,344, the measured downward target is $3,317. The above content is for reference only and does not constitute investment advice. MTF Special Analyst Zheng Guangfu
2025-08-14
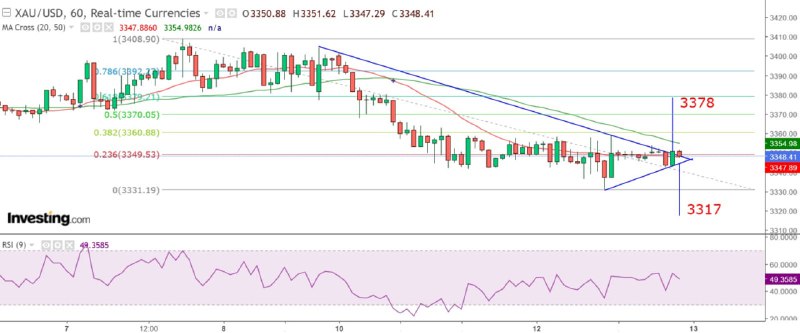
Gold prices are expected to rebound intraday. 13/8 10:06 am Finalized Yesterday, the US Department of Labor released the July CPI. The overall year-on-year increase remained at 2.7%, while the core CPI's year-on-year increase expanded from 2.9% to 3.1%. One of the reasons was that energy item prices dropped by 1.6% year-on-year. As for the monthly performance, the overall CPI increase slowed from 0.3% to 0.2%, with energy prices falling by 1.1% month-on-month. The core CPI, on the other hand, expanded from 0.2% to 0.3%. Investors interpreted the data in their own ways. US stock investors believed that the data increased the chances of a rate cut in September, and the three major US stock indexes opened higher. Currency traders also focused on the overall CPI performance. As the increase was lower than expected, non-US currencies rose sharply. The USD/JPY pair dropped sharply from the intraday high of 148.52 to 147.86. The EUR/USD pair also rose to 1.1668, and the GBP/USD pair rose to 1.3510. However, the US 10-year bond yield plunged to 4.235% and then rebounded to 4.328%, the highest since August 5. US inflation eases, putting pressure on gold prices Moreover, the easing of inflation has weakened gold's anti-inflationary role, putting pressure on the gold price. It has repeatedly challenged the $3,358 level but failed each time, instead frequently falling below $3,340, with the lowest point reaching $3,331. This raises concerns that even if the Federal Reserve does cut interest rates in September, the gold price may not benefit. From an hourly chart perspective, after the spot gold price broke through $3,360 on Monday of this week, it has generally moved sideways, but the trend has been extremely volatile, reflecting a fierce battle between bulls and bears. 3380 is the biggest resistance for the current market. For the time being, it is expected that the gold price will fluctuate above $3,340 within the day. This morning, the gold price has broken through the downtrend line on the hourly chart, and it is an effective breakthrough. The measured upward target is approximately $3,378, which is close to the 61.8% retracement level of the largest decline since last Thursday at $3,379. However, the $3,360 level is exactly the 38.2% retracement level, and the gold price will encounter double resistance when it rebounds to this level. If it fails to break through and regain momentum, it indicates a weak trend in the gold price. Therefore, it is expected that the gold price will fluctuate between $3,340 and $3,360 within the day. The maximum resistance for an upward breakthrough is $3,380. If it breaks below the extended support of the ascending trend line at $3,344, the measured downward target is $3,317. The above content is for reference only and does not constitute investment advice. MTF Special Analyst Zheng Guangfu

2025-08-13
Gold price remains range-bound in the medium term 12/8 09:45am Gold price continued to decline as expected yesterday, hitting a low of below $3,342. However, the support at $3,340 was strong, and the price rebounded after multiple tests of this level towards the end of the New York trading session. From the daily chart, it is evident that gold price has once again encountered strong resistance above $3,400. This is the fifth time since it reached a historical high of $3,500 in April that it has been clearly blocked and retreated above $3,400. Even if bulls still hold hope, they must wait for a break above $3,500 before considering following the trend. Otherwise, the gold price is likely to remain range-bound between $3,200 and $3,400. The current market is in a triangle formation waiting to be broken. Yesterday, the spot gold price closed at $3,349, slightly below the 50-day SMA ($3,349.6). This morning, it has climbed above $3,355. If the 50-day SMA once again serves as support, the gold price may develop into a narrowing triangle pattern within the day or in the short term. As yesterday's high and low points touched the ascending and descending tracks of the triangle respectively, before a breakthrough occurs, the gold price is likely to fluctuate between $3,340 and $3,405 in the short term. Observing the gold price's movement since it reached a new high of $3,500 in April this year, it has mainly fluctuated between a 21.4% correction ($3,419) and a 61.8% correction ($3,265). Currently, it is hovering around the 38.2% correction level ($3,355). If the gold price closes above $3,419 or below $3,265, it will be seen as a warning sign of a potential breakthrough; otherwise, it will remain in a sideways state. The intraday rebound is expected to be capped at $3,375. From the hourly chart, the gold price shows a small round bottom pattern. $3,358 can be regarded as resistance. If the hourly chart closes above this level, the upward target is $3,374.35, which is close to half of the maximum decline since yesterday, that is, $3,375.3. Therefore, an upward breakthrough is also expected to be constrained by this level. If it breaks down, support is estimated to be at $3,322. From the daily chart, if the gold price breaks above the descending triangle's lower trendline, the measured upward target is approximately $3,558. Conversely, if it breaks below the upper trendline, the measured downward target is about $3,285. However, I expect the gold price to remain weak for the most part this week. As the gold price closed with a large bearish candle yesterday and the closing price has approached the upper trendline, even if it breaks below the upper trendline today, it is temporarily regarded as a false breakout. The upward and downward targets mentioned above are calculated based on the support of the upper trendline and the resistance of the lower trendline extended to tomorrow. The above content is for reference only and does not constitute investment advice. MTF Special Analyst Zheng Guangfu
2025-08-13
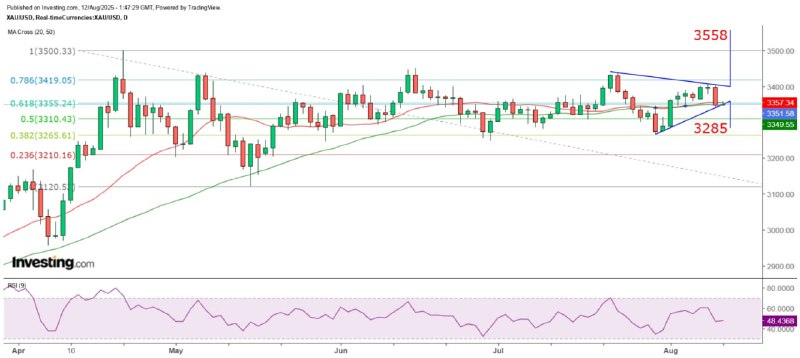
Gold price remains range-bound in the medium term 12/8 09:45am Gold price continued to decline as expected yesterday, hitting a low of below $3,342. However, the support at $3,340 was strong, and the price rebounded after multiple tests of this level towards the end of the New York trading session. From the daily chart, it is evident that gold price has once again encountered strong resistance above $3,400. This is the fifth time since it reached a historical high of $3,500 in April that it has been clearly blocked and retreated above $3,400. Even if bulls still hold hope, they must wait for a break above $3,500 before considering following the trend. Otherwise, the gold price is likely to remain range-bound between $3,200 and $3,400. The current market is in a triangle formation waiting to be broken. Yesterday, the spot gold price closed at $3,349, slightly below the 50-day SMA ($3,349.6). This morning, it has climbed above $3,355. If the 50-day SMA once again serves as support, the gold price may develop into a narrowing triangle pattern within the day or in the short term. As yesterday's high and low points touched the ascending and descending tracks of the triangle respectively, before a breakthrough occurs, the gold price is likely to fluctuate between $3,340 and $3,405 in the short term. Observing the gold price's movement since it reached a new high of $3,500 in April this year, it has mainly fluctuated between a 21.4% correction ($3,419) and a 61.8% correction ($3,265). Currently, it is hovering around the 38.2% correction level ($3,355). If the gold price closes above $3,419 or below $3,265, it will be seen as a warning sign of a potential breakthrough; otherwise, it will remain in a sideways state. The intraday rebound is expected to be capped at $3,375. From the hourly chart, the gold price shows a small round bottom pattern. $3,358 can be regarded as resistance. If the hourly chart closes above this level, the upward target is $3,374.35, which is close to half of the maximum decline since yesterday, that is, $3,375.3. Therefore, an upward breakthrough is also expected to be constrained by this level. If it breaks down, support is estimated to be at $3,322. From the daily chart, if the gold price breaks above the descending triangle's lower trendline, the measured upward target is approximately $3,558. Conversely, if it breaks below the upper trendline, the measured downward target is about $3,285. However, I expect the gold price to remain weak for the most part this week. As the gold price closed with a large bearish candle yesterday and the closing price has approached the upper trendline, even if it breaks below the upper trendline today, it is temporarily regarded as a false breakout. The upward and downward targets mentioned above are calculated based on the support of the upper trendline and the resistance of the lower trendline extended to tomorrow. The above content is for reference only and does not constitute investment advice. MTF Special Analyst Zheng Guangfu

2025-08-12
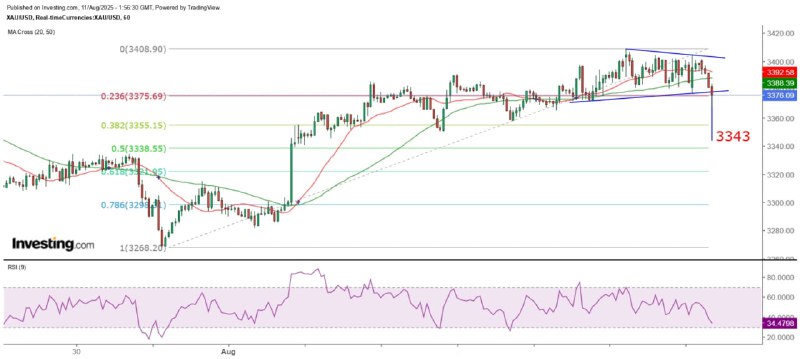
Gold prices have been weak this week. 11/8 09:55 am Finalized. Gold prices consolidated at high levels last Friday as expected. Although the Financial Times reported that according to a letter from the US Customs and Border Protection on July 31, gold bars of 1 kilogram and 100 ounces were to be classified as taxable, the specific details have not been made public. The news caused gold prices to drop sharply at one point, but then reports emerged that the White House would clarify that this was false information, and gold prices rebounded significantly. The daily trading range expanded to between $3,377 and $3,404. Inclusion of virtual currencies in 401(k) plans or a blow to gold prices? Last Thursday, Trump signed an executive order allowing alternative assets such as cryptocurrencies to be included in 401(k) plans, meaning that pension funds can purchase Bitcoin and Ethereum. In fact, the Michigan State Pension Fund has already bought 300,000 shares of ARK Bitcoin ETF and 460,000 shares of Grayscale Ethereum Trust to hold Bitcoin and Ethereum. What I want to say is that in the situation where investors have few other choices, this executive order will lead more funds to flow into the virtual currency market in an attempt to obtain greater returns, which will pose a certain degree of threat to the more traditional gold market. $3,338 is an important intraday support level. Although I expected the gold price to consolidate last Friday and then peak today before a significant adjustment, the key point is that it reflects the short-term peak of the gold price today. The spot gold price has continued to decline in the Asian market this morning and has broken through the TD ascending trend line on the hourly chart. The measured decline target is approximately $3,343, which is regarded as the first support level. If it adjusts by 50% of the largest increase since July 31, it will reach $3,338.55, which is considered an important support level for the day. At that time, $3,372 will become the short-term resistance for the rebound. Due to the obvious downward trend of the gold price this morning, it is almost impossible to break through $3,400 again within the day. A strong rebound to $3,390 is the limit. The US will release the CPI for July tomorrow. The market expects the overall year-on-year increase to slightly expand from 2.7% to 2.8%, and the core CPI year-on-year increase to expand from 2.9% to 3%. This may cause investors to reassess whether the Federal Reserve will cut interest rates in September, or further push down the gold price. Therefore, it is expected that the gold price will be weak this week. The above content is for reference only and does not constitute investment advice. MTF Special Analyst Zheng Guangfu
2025-08-12
Gold prices have been weak this week. 11/8 09:55 am Finalized. Gold prices consolidated at high levels last Friday as expected. Although the Financial Times reported that according to a letter from the US Customs and Border Protection on July 31, gold bars of 1 kilogram and 100 ounces were to be classified as taxable, the specific details have not been made public. The news caused gold prices to drop sharply at one point, but then reports emerged that the White House would clarify that this was false information, and gold prices rebounded significantly. The daily trading range expanded to between $3,377 and $3,404. Inclusion of virtual currencies in 401(k) plans or a blow to gold prices? Last Thursday, Trump signed an executive order allowing alternative assets such as cryptocurrencies to be included in 401(k) plans, meaning that pension funds can purchase Bitcoin and Ethereum. In fact, the Michigan State Pension Fund has already bought 300,000 shares of ARK Bitcoin ETF and 460,000 shares of Grayscale Ethereum Trust to hold Bitcoin and Ethereum. What I want to say is that in the situation where investors have few other choices, this executive order will lead more funds to flow into the virtual currency market in an attempt to obtain greater returns, which will pose a certain degree of threat to the more traditional gold market. $3,338 is an important intraday support level. Although I expected the gold price to consolidate last Friday and then peak today before a significant adjustment, the key point is that it reflects the short-term peak of the gold price today. The spot gold price has continued to decline in the Asian market this morning and has broken through the TD ascending trend line on the hourly chart. The measured decline target is approximately $3,343, which is regarded as the first support level. If it adjusts by 50% of the largest increase since July 31, it will reach $3,338.55, which is considered an important support level for the day. At that time, $3,372 will become the short-term resistance for the rebound. Due to the obvious downward trend of the gold price this morning, it is almost impossible to break through $3,400 again within the day. A strong rebound to $3,390 is the limit. The US will release the CPI for July tomorrow. The market expects the overall year-on-year increase to slightly expand from 2.7% to 2.8%, and the core CPI year-on-year increase to expand from 2.9% to 3%. This may cause investors to reassess whether the Federal Reserve will cut interest rates in September, or further push down the gold price. Therefore, it is expected that the gold price will be weak this week. The above content is for reference only and does not constitute investment advice. MTF Special Analyst Zheng Guangfu

2025-08-11
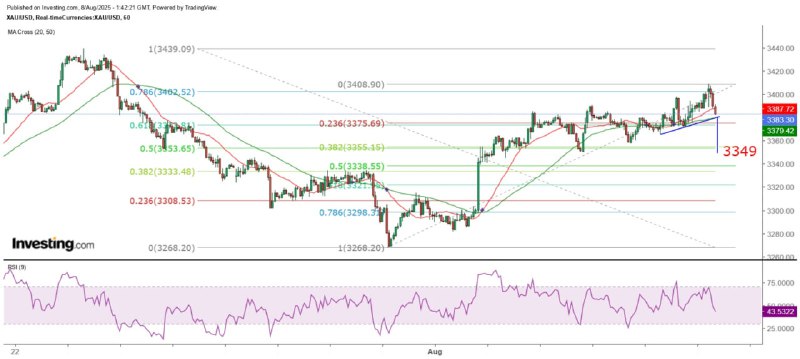
Gold prices are expected to consolidate today. 09:40 am, August 8th, completed The World Gold Council released a report on the US gold demand trend in the second quarter on August 6th. It mentioned that the overall gold demand in the US decreased by 34% quarter-on-quarter to 124 tons, but still increased by 110% year-on-year, mainly due to a large amount of funds flowing into gold ETFs in the first half of the year. As for consumer demand, the demand for jewelry, gold bars and gold coins decreased by 24% year-on-year to 39 tons. Among them, the demand for jewelry has been declining for three consecutive years, decreasing by 7% year-on-year to 30 tons in the second quarter. In contrast, the high gold price led to a 49% quarter-on-quarter increase in the total value of jewelry demand to 3 billion US dollars, and a 30% year-on-year increase. However, the demand for gold bars and gold coins dropped by 53% year-on-year to 9 tons, the lowest since the fourth quarter of 2019, which led to a 35% year-on-year decrease in the total value of investment demand to 929 million US dollars. Demand for gold ETFs continues to rise. Gold ETFs listed in the US increased their holdings by 70 tons in the second quarter and 203 tons in the first half of the year, bringing the total holdings to 1,785 tons at the end of the second quarter, with a total value of 189 billion US dollars. In terms of the proportion of investment demand, gold ETFs accounted for 70% and 56% in the first and second quarters respectively; jewelry demand for gold accounted for 12% and 24%; technical applications accounted for 9% and 12%; and demand for gold bars and coins was 8% and 7% respectively. It can be seen that gold ETFs are the main driving force supporting the gold price. Yesterday, the gold price movement was in line with my prediction. After breaking through the lower trend line of the narrowing triangle in the early Asian session on the hourly chart, it consolidated for four consecutive hours at the low of $3,371.7, close to the bottom of the large bullish candle that broke through at $3,370.2. It then rebounded and reached a high of $3,397.5 in the early European session, also close to the measured upside target of $3,399. Although it later pulled back sharply, the low was only $3,371.9, and it climbed again, approaching $3,402 at the end of the New York session. $3,365 remains a strong support. Spot gold prices rose to $3,408.9 in the early Asian session today but quickly retreated and once fell below $3,385. From the hourly chart, it can be seen that since the strong upward breakthrough on August 1st, the gold price has maintained an upward trend. However, it should be noted that if it breaks through the support of the ascending channel on the hourly chart (currently around $3,380), the downward target will point to $3,349. Currently, the 50-day SMA is slightly below $3,350, so it is expected that this line will become an important support level for the short-term adjustment of the gold price. However, this is a more pessimistic view. I estimate that the gold price is likely to fluctuate within yesterday's range today, that is, it will still hold above $3,365 and launch an offensive on Monday to challenge $3,450 before a more significant adjustment. The above content is for reference only and does not constitute investment advice. MTF Special Analyst Zheng Guangfu
2025-08-11
Gold prices are expected to consolidate today. 09:40 am, August 8th, completed The World Gold Council released a report on the US gold demand trend in the second quarter on August 6th. It mentioned that the overall gold demand in the US decreased by 34% quarter-on-quarter to 124 tons, but still increased by 110% year-on-year, mainly due to a large amount of funds flowing into gold ETFs in the first half of the year. As for consumer demand, the demand for jewelry, gold bars and gold coins decreased by 24% year-on-year to 39 tons. Among them, the demand for jewelry has been declining for three consecutive years, decreasing by 7% year-on-year to 30 tons in the second quarter. In contrast, the high gold price led to a 49% quarter-on-quarter increase in the total value of jewelry demand to 3 billion US dollars, and a 30% year-on-year increase. However, the demand for gold bars and gold coins dropped by 53% year-on-year to 9 tons, the lowest since the fourth quarter of 2019, which led to a 35% year-on-year decrease in the total value of investment demand to 929 million US dollars. Demand for gold ETFs continues to rise. Gold ETFs listed in the US increased their holdings by 70 tons in the second quarter and 203 tons in the first half of the year, bringing the total holdings to 1,785 tons at the end of the second quarter, with a total value of 189 billion US dollars. In terms of the proportion of investment demand, gold ETFs accounted for 70% and 56% in the first and second quarters respectively; jewelry demand for gold accounted for 12% and 24%; technical applications accounted for 9% and 12%; and demand for gold bars and coins was 8% and 7% respectively. It can be seen that gold ETFs are the main driving force supporting the gold price. Yesterday, the gold price movement was in line with my prediction. After breaking through the lower trend line of the narrowing triangle in the early Asian session on the hourly chart, it consolidated for four consecutive hours at the low of $3,371.7, close to the bottom of the large bullish candle that broke through at $3,370.2. It then rebounded and reached a high of $3,397.5 in the early European session, also close to the measured upside target of $3,399. Although it later pulled back sharply, the low was only $3,371.9, and it climbed again, approaching $3,402 at the end of the New York session. $3,365 remains a strong support. Spot gold prices rose to $3,408.9 in the early Asian session today but quickly retreated and once fell below $3,385. From the hourly chart, it can be seen that since the strong upward breakthrough on August 1st, the gold price has maintained an upward trend. However, it should be noted that if it breaks through the support of the ascending channel on the hourly chart (currently around $3,380), the downward target will point to $3,349. Currently, the 50-day SMA is slightly below $3,350, so it is expected that this line will become an important support level for the short-term adjustment of the gold price. However, this is a more pessimistic view. I estimate that the gold price is likely to fluctuate within yesterday's range today, that is, it will still hold above $3,365 and launch an offensive on Monday to challenge $3,450 before a more significant adjustment. The above content is for reference only and does not constitute investment advice. MTF Special Analyst Zheng Guangfu

2025-08-08
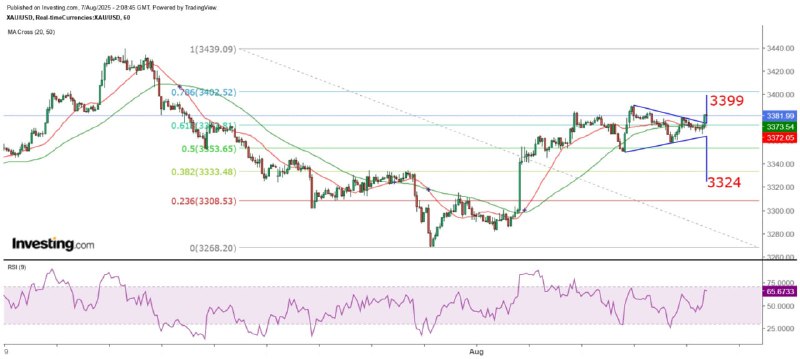
Gold prices are expected to break through $3,400 in the short term. 7/8 10:10 am Completed Two Federal Reserve policymakers expressed support for a rate cut in September yesterday. The president of the Federal Reserve Bank of Minneapolis, Kashkari, said that a rate cut may come soon. He believes that it may take a year or even longer to know whether the new tariffs imposed by the United States on foreign countries will continue to exert upward pressure on inflation. However, the current data clearly shows that the US economy is slowing down, which means that it may be appropriate for the Federal Reserve to start adjusting interest rates. At least four committee members support a rate cut in September. In addition, the president of the San Francisco Federal Reserve, Daly, also indicated that the time for a rate cut is approaching, and there may be a need for two or more rate cuts this year. If we include Waller and Bowman, who supported a rate cut at the July interest rate meeting, among the 12 decision-makers, including Chair Powell, four are likely to support a rate cut in September. If the August employment data released at the beginning of September shows no significant improvement, the possibility of a rate cut in September will be even greater. Gold prices fell initially yesterday but rebounded later. As seen from the hourly chart, they dropped to $3,358 in the early afternoon in Europe and then rose, but failed to break through $3,380 in the midday of New York and weakened. Today, they fell to $3,365 in the early Asian session and then rebounded in a piercing pattern, subsequently breaking through the high of yesterday's New York session and rising to nearly $3,382.5. $3,365 is a strong intraday support. From the hourly chart, gold prices are forming a narrowing triangle and have broken above the descending trend line. The measured upside target is $3,399, approaching the 78.6% retracement level of the largest decline since July 23 at $3,402.5. However, the daily range of gold prices in recent months has mostly been as high as $60. Even if the target is set at $3,400, the range would only be $30, which is within the normal range for gold prices. As gold prices have broken above the descending trend line of the narrowing triangle, it indicates that market forces have determined a new direction. Therefore, if gold prices can break above $3,390, they are likely to challenge $3,439 within the day. Of course, investors should also be prepared for both scenarios. If the prices fall below the descending trend line, the measured downside target is $3,324. However, at present, it is estimated that $3,365 is a strong support level for the day, and it is more likely that the prices will fluctuate above $3,370, with the main direction being a gradual test of higher levels. The above content is for reference only and does not constitute investment advice. MTF Special Analyst Zheng Guangfu
2025-08-08
Gold prices are expected to break through $3,400 in the short term. 7/8 10:10 am Completed Two Federal Reserve policymakers expressed support for a rate cut in September yesterday. The president of the Federal Reserve Bank of Minneapolis, Kashkari, said that a rate cut may come soon. He believes that it may take a year or even longer to know whether the new tariffs imposed by the United States on foreign countries will continue to exert upward pressure on inflation. However, the current data clearly shows that the US economy is slowing down, which means that it may be appropriate for the Federal Reserve to start adjusting interest rates. At least four committee members support a rate cut in September. In addition, the president of the San Francisco Federal Reserve, Daly, also indicated that the time for a rate cut is approaching, and there may be a need for two or more rate cuts this year. If we include Waller and Bowman, who supported a rate cut at the July interest rate meeting, among the 12 decision-makers, including Chair Powell, four are likely to support a rate cut in September. If the August employment data released at the beginning of September shows no significant improvement, the possibility of a rate cut in September will be even greater. Gold prices fell initially yesterday but rebounded later. As seen from the hourly chart, they dropped to $3,358 in the early afternoon in Europe and then rose, but failed to break through $3,380 in the midday of New York and weakened. Today, they fell to $3,365 in the early Asian session and then rebounded in a piercing pattern, subsequently breaking through the high of yesterday's New York session and rising to nearly $3,382.5. $3,365 is a strong intraday support. From the hourly chart, gold prices are forming a narrowing triangle and have broken above the descending trend line. The measured upside target is $3,399, approaching the 78.6% retracement level of the largest decline since July 23 at $3,402.5. However, the daily range of gold prices in recent months has mostly been as high as $60. Even if the target is set at $3,400, the range would only be $30, which is within the normal range for gold prices. As gold prices have broken above the descending trend line of the narrowing triangle, it indicates that market forces have determined a new direction. Therefore, if gold prices can break above $3,390, they are likely to challenge $3,439 within the day. Of course, investors should also be prepared for both scenarios. If the prices fall below the descending trend line, the measured downside target is $3,324. However, at present, it is estimated that $3,365 is a strong support level for the day, and it is more likely that the prices will fluctuate above $3,370, with the main direction being a gradual test of higher levels. The above content is for reference only and does not constitute investment advice. MTF Special Analyst Zheng Guangfu

2025-08-07
"Gold Prices May Be on the Verge of a Deep Correction" 6/8 10:00am Completed Yesterday's gold price movement largely conformed to my expectations. The spot gold price reached a low of $3,350, which was below the end of wave 3 at $3,385.44 and the 38.2% retracement level of wave 4 at $3,356.73. Subsequently, wave 5 began, with its target calculated as 38.2% of the amplitude of wave 3, which is $3,389.61. Yesterday's high of $3,390.51 was $0.9 above this target. Additionally, yesterday's expectation was that gold prices would reach a short-term peak on that day, suggesting that a potential ABC correction wave might be in the works, with a target of $3,314.86. According to the wave theory, if the low of wave c falls below the top of wave 1, a higher-level (3) wave will unfold. The movement from July 31 to August 6 becomes a higher-level (1) wave. However, the wave theory only stipulates that wave 3 cannot be the shortest but can be the longest. Assuming that the rise of wave 5 is equal to that of wave 3, the gold price could rise to $3,453.7. Therefore, investors still need to pay attention. If the gold price does not show a significant adjustment today but instead further breaks through yesterday's high of $3,390.51 and maintains a strong trend, it may challenge the July 23 high of $3,439.09. Gold prices may be affected by the remarks of the Federal Reserve Board members. On the news front, several Federal Reserve officials will speak early Thursday morning (tonight). If they hint at a high probability of a rate cut in September, gold prices may rise on the back of this. However, gold's performance since last Friday has already reflected market expectations of a September rate cut, so the potential increase in gold prices may not be too significant. Investors can calculate resistance levels based on the relationship between the 5-wave and 3-wave movements. At 38.2%, the resistance level is approximately $3,390, and at 61.8%, it is around $3,414. $3,350 is an important support level in the spot market. Since June, the daily fluctuation range of gold prices has mostly been between 20 and 60 US dollars. At the current low of 3,373 US dollars, a rise of 60 US dollars would equal 3,433 US dollars, slightly higher than the 78.6% of the 3rd wave's equivalent to the 5th wave's increase, which is 3,431.5 US dollars. Conversely, if the gold price drops, at the current high of 3,383.65 US dollars, the major support level is at 3,323.65 US dollars. Based on the maximum increase since July 31, the 50% and 61.8% retracement levels can be seen at 3,329.36 and 3,314.92 US dollars respectively. The key support level for gold prices within the day is clearly 3,350 US dollars. Once this level is breached, 3,329 and 3,314 US dollars will be the next targets to test. This morning, the gold price rose slightly and then fell back, showing a bearish signal on the hourly chart. It is expected that for most of the day, the gold price will fluctuate between 3,350 and 3,385 US dollars, and a breakthrough may occur after the remarks of the Federal Reserve Board members tonight. The above content is for reference only and does not constitute investment advice. MTF Special Analyst Zheng Guangfu

2025-08-07
"Gold Prices May Be on the Verge of a Deep Correction" 6/8 10:00am Completed Yesterday's gold price movement largely conformed to my expectations. The spot gold price reached a low of $3,350, which was below the end of wave 3 at $3,385.44 and the 38.2% retracement level of wave 4 at $3,356.73. Subsequently, wave 5 began, with its target calculated as 38.2% of the amplitude of wave 3, which is $3,389.61. Yesterday's high of $3,390.51 was $0.9 above this target. Additionally, yesterday's expectation was that gold prices would reach a short-term peak on that day, suggesting that a potential ABC correction wave might be in the works, with a target of $3,314.86. According to the wave theory, if the low of wave c falls below the top of wave 1, a higher-level (3) wave will unfold. The movement from July 31 to August 6 becomes a higher-level (1) wave. However, the wave theory only stipulates that wave 3 cannot be the shortest but can be the longest. Assuming that the rise of wave 5 is equal to that of wave 3, the gold price could rise to $3,453.7. Therefore, investors still need to pay attention. If the gold price does not show a significant adjustment today but instead further breaks through yesterday's high of $3,390.51 and maintains a strong trend, it may challenge the July 23 high of $3,439.09. Gold prices may be affected by the remarks of the Federal Reserve Board members. On the news front, several Federal Reserve officials will speak early Thursday morning (tonight). If they hint at a high probability of a rate cut in September, gold prices may rise on the back of this. However, gold's performance since last Friday has already reflected market expectations of a September rate cut, so the potential increase in gold prices may not be too significant. Investors can calculate resistance levels based on the relationship between the 5-wave and 3-wave movements. At 38.2%, the resistance level is approximately $3,390, and at 61.8%, it is around $3,414. $3,350 is an important support level in the spot market. Since June, the daily fluctuation range of gold prices has mostly been between 20 and 60 US dollars. At the current low of 3,373 US dollars, a rise of 60 US dollars would equal 3,433 US dollars, slightly higher than the 78.6% of the 3rd wave's equivalent to the 5th wave's increase, which is 3,431.5 US dollars. Conversely, if the gold price drops, at the current high of 3,383.65 US dollars, the major support level is at 3,323.65 US dollars. Based on the maximum increase since July 31, the 50% and 61.8% retracement levels can be seen at 3,329.36 and 3,314.92 US dollars respectively. The key support level for gold prices within the day is clearly 3,350 US dollars. Once this level is breached, 3,329 and 3,314 US dollars will be the next targets to test. This morning, the gold price rose slightly and then fell back, showing a bearish signal on the hourly chart. It is expected that for most of the day, the gold price will fluctuate between 3,350 and 3,385 US dollars, and a breakthrough may occur after the remarks of the Federal Reserve Board members tonight. The above content is for reference only and does not constitute investment advice. MTF Special Analyst Zheng Guangfu

2025-08-06
"Gold Price Short-Term Top to Be Seen Entering Wave 4" 5/8 10:12 am Completed As the saying goes, "Good fortune does not come twice, and misfortune never comes alone." After the US dollar exchange rate was hit by the deviated July non-farm payroll report last Friday, it was further affected by the June factory orders last night. Data showed that new orders for US manufacturing decreased by 4.8% month-on-month in June, far worse than the revised increase of 8.3% in May. It was the second month of decline in the past three months, and the decline was the largest since April 2020. However, after a significant increase in factory orders in May and June, they dropped sharply, apparently due to the impact of Trump's announcement of imposing extremely high reciprocal tariffs. It is believed that enterprises were worried about a substantial increase in import costs, so they placed a large number of orders in May, compressing the order demand for the coming period into May. This naturally led to a substantial decrease in orders in June. Break through $3,385 or form a double top Of course, the financial market is bound to reflect good or bad news or data in advance. Therefore, the gold price had already risen to the level of $3,385.44 last night before the data was released. After the actual decline was close to the expected level, the gold price quickly fell back but stabilized at the $3,370 level and then rose again. From the hourly chart, the current gold price may be in the third wave of the upward trend that began last Wednesday, and it has exceeded the usual target of 1.618 times the first wave, which is $3,357.24. The next target is 2.618 times the first wave, which is $3,403.9. Assuming that the gold price reaches $3,403.9 and then enters the fourth wave, the decline targets would be $3,374.45 or $3,356.73. If $3,385.44 is the top of the third wave, the correction targets would be $3,360.97 or $3,345.83, respectively, and then the fifth wave would start. On the other hand, investors should note that the gold price is expected to reach a short-term peak today. If it breaks through the high of yesterday at $3,385, a small double top may form. Investors should pay attention to the bearish signal of the candlestick chart on the hourly chart. From the daily chart, the gold price has risen above the 20-day and 50-day SMAs, but the two moving averages are trending sideways and have no predictive value. The more optimistic prediction is that the gold price will continue to range between $3,245 and $3,500. The above content is for reference only and does not constitute investment advice. MTF Special Analyst Zheng Guangfu


