
 en-US
en-US 

 Telegram
 WeChat

2025-08-06
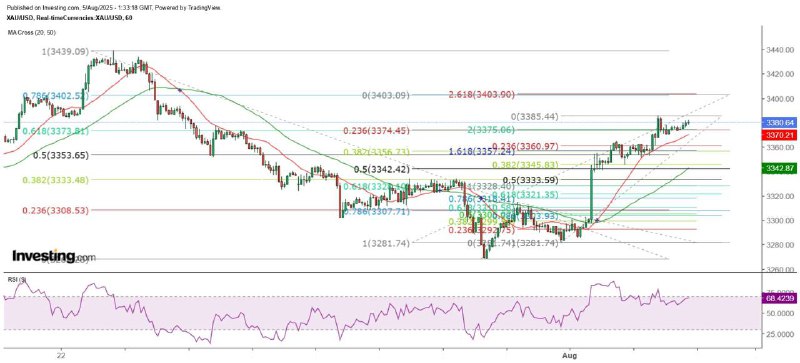
"Gold Price Short-Term Top to Be Seen Entering Wave 4" 5/8 10:12 am Completed As the saying goes, "Good fortune does not come twice, and misfortune never comes alone." After the US dollar exchange rate was hit by the deviated July non-farm payroll report last Friday, it was further affected by the June factory orders last night. Data showed that new orders for US manufacturing decreased by 4.8% month-on-month in June, far worse than the revised increase of 8.3% in May. It was the second month of decline in the past three months, and the decline was the largest since April 2020. However, after a significant increase in factory orders in May and June, they dropped sharply, apparently due to the impact of Trump's announcement of imposing extremely high reciprocal tariffs. It is believed that enterprises were worried about a substantial increase in import costs, so they placed a large number of orders in May, compressing the order demand for the coming period into May. This naturally led to a substantial decrease in orders in June. Break through $3,385 or form a double top Of course, the financial market is bound to reflect good or bad news or data in advance. Therefore, the gold price had already risen to the level of $3,385.44 last night before the data was released. After the actual decline was close to the expected level, the gold price quickly fell back but stabilized at the $3,370 level and then rose again. From the hourly chart, the current gold price may be in the third wave of the upward trend that began last Wednesday, and it has exceeded the usual target of 1.618 times the first wave, which is $3,357.24. The next target is 2.618 times the first wave, which is $3,403.9. Assuming that the gold price reaches $3,403.9 and then enters the fourth wave, the decline targets would be $3,374.45 or $3,356.73. If $3,385.44 is the top of the third wave, the correction targets would be $3,360.97 or $3,345.83, respectively, and then the fifth wave would start. On the other hand, investors should note that the gold price is expected to reach a short-term peak today. If it breaks through the high of yesterday at $3,385, a small double top may form. Investors should pay attention to the bearish signal of the candlestick chart on the hourly chart. From the daily chart, the gold price has risen above the 20-day and 50-day SMAs, but the two moving averages are trending sideways and have no predictive value. The more optimistic prediction is that the gold price will continue to range between $3,245 and $3,500. The above content is for reference only and does not constitute investment advice. MTF Special Analyst Zheng Guangfu

2025-08-05
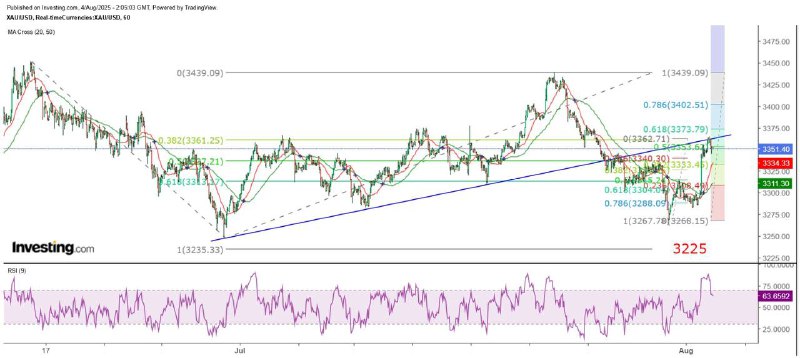
"Gold Prices Expected to Adjust After Sharp Rise" 4/8 10:08 am Final Draft Although I predicted last Friday that gold prices would end the decline that began on July 23rd on that day, the price did indeed rebound strongly, but its sudden break above the 20-day and 50-day SMAs to reach a high of $3,363.50 was unexpected. Clearly, the main reason was that the number of new non-farm jobs added in the US in July was less than expected. The overall non-farm payroll increased by only 74,000, less than the expected 106,000, and private sector jobs increased by only 83,000. However, what was even more surprising was that the number of new jobs added in June was revised sharply downward from an initial estimate of 147,000 to only 14,000; the number of new private sector jobs was also revised sharply downward from an initial estimate of 74,000 to only 3,000, while the unemployment rate rose by 0.1 percentage point as expected to 4.2%. The non-farm payroll data for July did not deteriorate across the board. Although the non-farm payroll figure was surprisingly poor, there were some reassuring sub-components in the employment report. For instance, the average hourly earnings of private sector workers rose from $36.32 to $36.44, and the average weekly hours worked increased from 34.2 to 34.3. In terms of job changes, manufacturing jobs continued to decline by 13,000 for the third consecutive month in July, but service sector jobs increased by 96,000, far exceeding the 16,000 in June and 82,000 in May. Among them, retail trade jobs increased by 15,700 in July after a decrease of 14,300 in June. Looking at the reasons for unemployment, the number of people who became unemployed and ended their temporary jobs increased by 112,000; those who quit their jobs decreased by 41,000; those re-entering the labor market increased by 35,000, and the number of new entrants rose significantly by 275,000. Regarding the duration of unemployment, the number of those unemployed for less than five weeks increased by 58,000; those unemployed for five to fourteen weeks decreased by 97,000, reflecting the rapid absorption of the labor force. The number of those unemployed for fifteen to twenty-six weeks increased by 104,000, and those unemployed for more than twenty-six weeks rose by 179,000. Long-term unemployed individuals are mostly those targeting specific job types or demanding higher salaries. Additionally, the population not counted in the labor market decreased by 101,000, while the number of those who have no intention of seeking employment decreased significantly by 212,000. Gold price rises close to the resistance level of $3,374. I believe that the sharp decline in non-farm payrolls to only 19,000 and 14,000 in May and June respectively is closely related to Trump's reciprocal tariff measures. However, with the US reaching agreements with several major trading partners and continuing negotiations after the August 1 deadline, it is not surprising that non-farm payrolls increased significantly in August. After a sharp rise last Friday, gold prices dropped sharply in the Asian market this morning to a low of $3,335. From the hourly chart, gold prices are constrained by the resistance of the extended upward trend line formed since June 28 at $3,363. Assuming that the current stage is the third wave, the lowest point could be a pullback to around but above $3,303.76. If it rebounds by 61.8% of the largest decline since July 23, gold prices could reach $3,373.8. I believe that gold prices will encounter significant resistance at this level. I expect $3,334 to be the first support level for the day, and in the short term, it is likely to fluctuate between $3,304 and $3,374. The above content is for reference only and does not constitute investment advice. MTF Special Analyst Zheng Guangfu
2025-08-05
"Gold Prices Expected to Adjust After Sharp Rise" 4/8 10:08 am Final Draft Although I predicted last Friday that gold prices would end the decline that began on July 23rd on that day, the price did indeed rebound strongly, but its sudden break above the 20-day and 50-day SMAs to reach a high of $3,363.50 was unexpected. Clearly, the main reason was that the number of new non-farm jobs added in the US in July was less than expected. The overall non-farm payroll increased by only 74,000, less than the expected 106,000, and private sector jobs increased by only 83,000. However, what was even more surprising was that the number of new jobs added in June was revised sharply downward from an initial estimate of 147,000 to only 14,000; the number of new private sector jobs was also revised sharply downward from an initial estimate of 74,000 to only 3,000, while the unemployment rate rose by 0.1 percentage point as expected to 4.2%. The non-farm payroll data for July did not deteriorate across the board. Although the non-farm payroll figure was surprisingly poor, there were some reassuring sub-components in the employment report. For instance, the average hourly earnings of private sector workers rose from $36.32 to $36.44, and the average weekly hours worked increased from 34.2 to 34.3. In terms of job changes, manufacturing jobs continued to decline by 13,000 for the third consecutive month in July, but service sector jobs increased by 96,000, far exceeding the 16,000 in June and 82,000 in May. Among them, retail trade jobs increased by 15,700 in July after a decrease of 14,300 in June. Looking at the reasons for unemployment, the number of people who became unemployed and ended their temporary jobs increased by 112,000; those who quit their jobs decreased by 41,000; those re-entering the labor market increased by 35,000, and the number of new entrants rose significantly by 275,000. Regarding the duration of unemployment, the number of those unemployed for less than five weeks increased by 58,000; those unemployed for five to fourteen weeks decreased by 97,000, reflecting the rapid absorption of the labor force. The number of those unemployed for fifteen to twenty-six weeks increased by 104,000, and those unemployed for more than twenty-six weeks rose by 179,000. Long-term unemployed individuals are mostly those targeting specific job types or demanding higher salaries. Additionally, the population not counted in the labor market decreased by 101,000, while the number of those who have no intention of seeking employment decreased significantly by 212,000. Gold price rises close to the resistance level of $3,374. I believe that the sharp decline in non-farm payrolls to only 19,000 and 14,000 in May and June respectively is closely related to Trump's reciprocal tariff measures. However, with the US reaching agreements with several major trading partners and continuing negotiations after the August 1 deadline, it is not surprising that non-farm payrolls increased significantly in August. After a sharp rise last Friday, gold prices dropped sharply in the Asian market this morning to a low of $3,335. From the hourly chart, gold prices are constrained by the resistance of the extended upward trend line formed since June 28 at $3,363. Assuming that the current stage is the third wave, the lowest point could be a pullback to around but above $3,303.76. If it rebounds by 61.8% of the largest decline since July 23, gold prices could reach $3,373.8. I believe that gold prices will encounter significant resistance at this level. I expect $3,334 to be the first support level for the day, and in the short term, it is likely to fluctuate between $3,304 and $3,374. The above content is for reference only and does not constitute investment advice. MTF Special Analyst Zheng Guangfu

2025-08-04
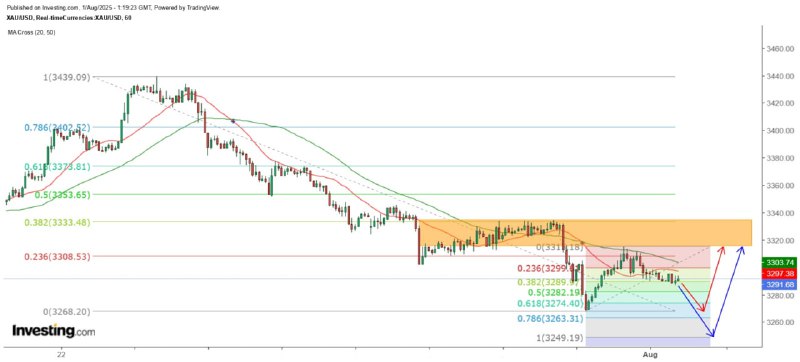
Gold prices are expected to complete a short-term decline. 1/8 09:30am Finalized The Fed's decision to keep interest rates unchanged has supported the strengthening of the US dollar, putting pressure on gold prices. However, after hitting a low of $3,268 in the late New York session on Wednesday, gold gradually regained lost ground. Yesterday, in the early European session, it approached $3,315, surpassing my expected level of $3,305. However, it soon retreated. Subsequently, gold prices were further affected by the expansion of the US June PCE growth rate, falling back below $3,300 in the early New York session yesterday. As of this morning in the Asian session, gold prices have been fluctuating narrowly below that level. The Fed's interest rate statement and Powell's speech have reduced the possibility of a rate cut in September. Interest rate futures show that the market expects a 0.25% rate cut in September with only a 38.2% probability, while the probability of maintaining the interest rate unchanged is 61.8%. The probability of a 0.25% rate cut in October is only 46.8%. Tonight, the US Department of Labor will release the July non-farm payroll report. Non-farm payrolls are expected to increase by 106,000, less than the 147,000 in June. The unemployment rate is expected to rise by 0.1 percentage point to 4.2%. However, the chance of a rate cut in September is slim, and the US employment data seems unlikely to support a significant reversal of the gold price's weakness. The 20-day and 50-day moving averages form medium-term resistance. From the daily chart, gold has broken through the 20-day SMA (3337) and the 50-day SMA (3341). It is believed that these two moving averages have become the main resistance for the medium-term rebound. On the other hand, after falling to 3245.5 and 3247.8 dollars at the end of May and June respectively, gold reversed direction on the same day and closed with a bullish candle. Therefore, investors should pay attention that if gold tests 3245 dollars again in the future and closes with a bearish candle, or fails to rebound and fluctuates narrowly around that level, it is expected that gold will break down and the first target for the decline will still be 3225 dollars. From the hourly chart, the gold price has rebounded by more than 46 dollars from the low of 3,268 dollars after the Fed's interest rate announcement, which is only slightly more than 23.6% of the biggest decline since July 23. If it rebounds by 38.2% to 3,333.48 dollars, it will be the level that the gold price has repeatedly broken through on Tuesday and Wednesday this week but has been met with heavy selling pressure. If the Fibonacci extension line is used to measure the trend since July 30, and the extent reaches 100%, the gold price will fall to 3,249.19 dollars. Gold price at 3,268 may show a double bottom rebound. However, it is also necessary to note that the gold price may test the previous low of $3,268 and then find support. Even if it slightly breaks through this level, it is possible to see a double bottom rebound. Therefore, when the gold price drops to the range of $3,268 to $3,249, investors should pay attention to the reversal signals on the hourly chart. For the time being, it is judged that the gold price will end the decline since July 23rd today and start a rebound wave again next week. Based on the current calculation, it is expected to encounter resistance at $3,315 and $3,334 during this period. The 20-day and 50-day SMA are regarded as the ultimate upward targets. After that, it is expected to fall again. The above content is for reference only and does not constitute investment advice. MTF Special Analyst Zheng Guangfu
2025-08-04
Gold prices are expected to complete a short-term decline. 1/8 09:30am Finalized The Fed's decision to keep interest rates unchanged has supported the strengthening of the US dollar, putting pressure on gold prices. However, after hitting a low of $3,268 in the late New York session on Wednesday, gold gradually regained lost ground. Yesterday, in the early European session, it approached $3,315, surpassing my expected level of $3,305. However, it soon retreated. Subsequently, gold prices were further affected by the expansion of the US June PCE growth rate, falling back below $3,300 in the early New York session yesterday. As of this morning in the Asian session, gold prices have been fluctuating narrowly below that level. The Fed's interest rate statement and Powell's speech have reduced the possibility of a rate cut in September. Interest rate futures show that the market expects a 0.25% rate cut in September with only a 38.2% probability, while the probability of maintaining the interest rate unchanged is 61.8%. The probability of a 0.25% rate cut in October is only 46.8%. Tonight, the US Department of Labor will release the July non-farm payroll report. Non-farm payrolls are expected to increase by 106,000, less than the 147,000 in June. The unemployment rate is expected to rise by 0.1 percentage point to 4.2%. However, the chance of a rate cut in September is slim, and the US employment data seems unlikely to support a significant reversal of the gold price's weakness. The 20-day and 50-day moving averages form medium-term resistance. From the daily chart, gold has broken through the 20-day SMA (3337) and the 50-day SMA (3341). It is believed that these two moving averages have become the main resistance for the medium-term rebound. On the other hand, after falling to 3245.5 and 3247.8 dollars at the end of May and June respectively, gold reversed direction on the same day and closed with a bullish candle. Therefore, investors should pay attention that if gold tests 3245 dollars again in the future and closes with a bearish candle, or fails to rebound and fluctuates narrowly around that level, it is expected that gold will break down and the first target for the decline will still be 3225 dollars. From the hourly chart, the gold price has rebounded by more than 46 dollars from the low of 3,268 dollars after the Fed's interest rate announcement, which is only slightly more than 23.6% of the biggest decline since July 23. If it rebounds by 38.2% to 3,333.48 dollars, it will be the level that the gold price has repeatedly broken through on Tuesday and Wednesday this week but has been met with heavy selling pressure. If the Fibonacci extension line is used to measure the trend since July 30, and the extent reaches 100%, the gold price will fall to 3,249.19 dollars. Gold price at 3,268 may show a double bottom rebound. However, it is also necessary to note that the gold price may test the previous low of $3,268 and then find support. Even if it slightly breaks through this level, it is possible to see a double bottom rebound. Therefore, when the gold price drops to the range of $3,268 to $3,249, investors should pay attention to the reversal signals on the hourly chart. For the time being, it is judged that the gold price will end the decline since July 23rd today and start a rebound wave again next week. Based on the current calculation, it is expected to encounter resistance at $3,315 and $3,334 during this period. The 20-day and 50-day SMA are regarded as the ultimate upward targets. After that, it is expected to fall again. The above content is for reference only and does not constitute investment advice. MTF Special Analyst Zheng Guangfu

2025-08-01
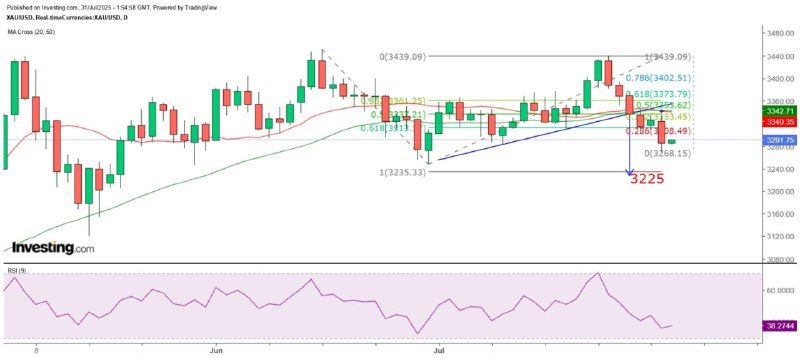
"Objective Conditions Hinder Gold Price Rebound" 31/7 09:46 am Completed Yesterday, the gold price continued to decline. Although it closed at $3,332 on the hourly chart, bulls did not dare to take advantage of the small victory to attack. After the New York market opened, the gold price dropped sharply as ADP announced that the number of new jobs in the private sector in July reached 104,000, exceeding the expected 77,000. The lowest point was only slightly below $3,389. After that, it gradually rebounded and rose to nearly $3,305 before the Federal Reserve announced the interest rate decision. However, after the authorities announced that the interest rate would remain unchanged, the gold price dropped sharply again, reaching a low of around $3,268. The September interest rate decision will still depend on the data. The Federal Reserve kept the target range for the federal funds rate at 4.25% to 4.5%, but two board members, Waller and Bowman, supported a rate cut. This was the first time in 30 years that a board member dissented. At the press conference, Fed Chair Powell pointed out that the current policy stance is in a favorable position and that the September meeting will need to rely on data to make a decision. Regarding inflation, it is expected that the core PCE will rise by 2.7% year-on-year in June, and the overall PCE will increase by 2.5%. Most long-term inflation expectations indicators are in line with the target, but they are further from the target than the employment data and are expected to be more affected by additional tariffs. In addition, the authorities believe that the labor market remains in a balanced state, but there are clearly downside risks. Although the economic performance is solid, indicators show that growth is slowing down. At the same time, they do not think that the Big and Beautiful Act has particularly stimulated economic growth. As for the impact of tariffs, the authorities believe that most of the estimates of effective tariffs have not changed much. It is reasonable to infer that the impact of tariffs on inflation is short-term, and three or four tenths of core inflation may come from tariffs. It is too early to assess its impact now. Gold price rebound stalls at $3,305. From the daily chart, gold prices have closed below the 50-day SMA (3342) for four consecutive trading days, and the 20-day SMA (3340) has also fallen below the 50-day SMA. The bearish signals are increasing. Calculated by breaking through the TD ascending channel, the downside target is approximately $3,225; measured by the Fibonacci 100% extension, the downside target is approximately $3,235. It is expected that the 20-day and 50-day SMAs will become the main resistance for a medium-term rebound. Even if gold prices return above the two moving averages, it is at most a return to a sideways range rather than a re-strengthening. It is believed that only when gold prices break through and hold above $3,500 will the bears be willing to surrender! Gold prices are expected to remain under heavy selling pressure in the short term. The first key resistance level for the day is at $3,305. Measured from yesterday's high of $3,334.19 using Fibonacci expansion, if the decline reaches 100%, the target would be $3,225. Under the current circumstances, it is difficult for gold prices to stage a rebound. The possibility of testing $3,225 has increased significantly. At that point, gold prices will fall below the June 30 low of $3,235.33, and the trend will turn downward. The above content is for reference only and does not constitute investment advice. MTF Special Analyst Zheng Guangfu
2025-08-01
"Objective Conditions Hinder Gold Price Rebound" 31/7 09:46 am Completed Yesterday, the gold price continued to decline. Although it closed at $3,332 on the hourly chart, bulls did not dare to take advantage of the small victory to attack. After the New York market opened, the gold price dropped sharply as ADP announced that the number of new jobs in the private sector in July reached 104,000, exceeding the expected 77,000. The lowest point was only slightly below $3,389. After that, it gradually rebounded and rose to nearly $3,305 before the Federal Reserve announced the interest rate decision. However, after the authorities announced that the interest rate would remain unchanged, the gold price dropped sharply again, reaching a low of around $3,268. The September interest rate decision will still depend on the data. The Federal Reserve kept the target range for the federal funds rate at 4.25% to 4.5%, but two board members, Waller and Bowman, supported a rate cut. This was the first time in 30 years that a board member dissented. At the press conference, Fed Chair Powell pointed out that the current policy stance is in a favorable position and that the September meeting will need to rely on data to make a decision. Regarding inflation, it is expected that the core PCE will rise by 2.7% year-on-year in June, and the overall PCE will increase by 2.5%. Most long-term inflation expectations indicators are in line with the target, but they are further from the target than the employment data and are expected to be more affected by additional tariffs. In addition, the authorities believe that the labor market remains in a balanced state, but there are clearly downside risks. Although the economic performance is solid, indicators show that growth is slowing down. At the same time, they do not think that the Big and Beautiful Act has particularly stimulated economic growth. As for the impact of tariffs, the authorities believe that most of the estimates of effective tariffs have not changed much. It is reasonable to infer that the impact of tariffs on inflation is short-term, and three or four tenths of core inflation may come from tariffs. It is too early to assess its impact now. Gold price rebound stalls at $3,305. From the daily chart, gold prices have closed below the 50-day SMA (3342) for four consecutive trading days, and the 20-day SMA (3340) has also fallen below the 50-day SMA. The bearish signals are increasing. Calculated by breaking through the TD ascending channel, the downside target is approximately $3,225; measured by the Fibonacci 100% extension, the downside target is approximately $3,235. It is expected that the 20-day and 50-day SMAs will become the main resistance for a medium-term rebound. Even if gold prices return above the two moving averages, it is at most a return to a sideways range rather than a re-strengthening. It is believed that only when gold prices break through and hold above $3,500 will the bears be willing to surrender! Gold prices are expected to remain under heavy selling pressure in the short term. The first key resistance level for the day is at $3,305. Measured from yesterday's high of $3,334.19 using Fibonacci expansion, if the decline reaches 100%, the target would be $3,225. Under the current circumstances, it is difficult for gold prices to stage a rebound. The possibility of testing $3,225 has increased significantly. At that point, gold prices will fall below the June 30 low of $3,235.33, and the trend will turn downward. The above content is for reference only and does not constitute investment advice. MTF Special Analyst Zheng Guangfu
2025-07-31
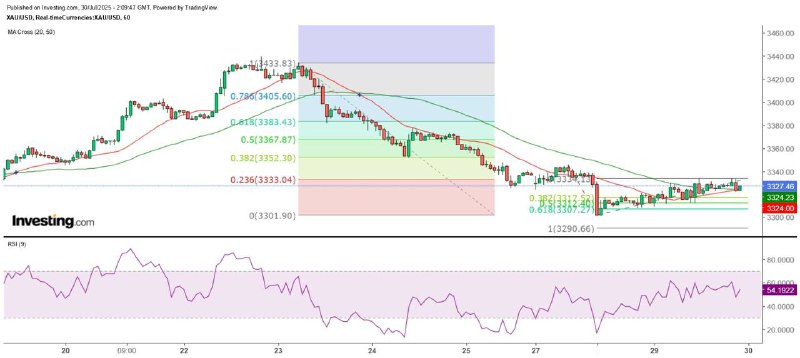
"Gold Price at 3330 Becomes Key Support and Resistance Level" 30/7 10:05 am Finalized After the US and the EU reached a trade agreement, they immediately began negotiations with China. Li Chenggang, the representative for international trade negotiations and vice minister of the Ministry of Commerce of China, said that within less than two days, both sides had in-depth, candid and constructive exchanges on major issues of mutual concern. This indicates that there is still a lot of room for negotiation and it is believed that it will be difficult to reach a specific trade agreement before August 1st. In terms of data, ADP will release the July private sector job changes tonight, with an expected increase of 77,000, reflecting the labor market starting to deteriorate. This could be an excuse for investors to sell the US dollar, thereby stimulating the rise in gold prices. However, the focus is still on the Federal Reserve's interest rate decision and the release of the July non-farm payroll report on Friday. Yesterday, the fluctuation range of gold prices narrowed significantly. It is believed that investors are waiting for the Federal Reserve to announce the interest rate decision and a series of US economic data. From the four-hour chart, the spot gold price rose to a high of $3,334 yesterday, indeed encountering the resistance at $3,340 mentioned yesterday. If observed from the one-hour chart, the immediate resistance for gold is at $3,330. In other words, the actual high of gold prices is close to the median of the lower and higher time frame resistances. However, looking at the closing price of gold on the one-hour chart, it did not close above the top of the large bearish candle on July 28 at $3,330, nor above the top of the large bearish candle on the four-hour chart at $3,338. Therefore, which time frame's technical signals to refer to seems to be entirely dependent on investors' risk tolerance. The daily chart forms a medium-term adjustment pattern. From the hourly chart, the gold price has shown the initial formation of a descending flag pattern since July 28th. In the short term, it is inclined to take $3,330 as resistance, with a greater chance of a downward movement. Although the gold price reached a high of $3,333 in the Asian session this morning, it failed to close above $3,330 on the hourly chart and then dropped sharply to the $3,321 level. Using the Fibonacci extension to calculate the movements on Monday and Tuesday, coincidentally, if the gold price reaches the 100% extension level, the target is the same at $3,290, indicating that this level is a strong support for the gold price within the day. The resistance for a rebound within the day is expected to be $3,370. Additionally, investors should note that the gold price has closed below the 50-day SMA ($3,343.5) for three consecutive trading days on the daily chart, and the 20-day SMA ($3,344) is also overlapping with the 50-day SMA and moving downward. Overall, a mid-term adjustment pattern is being formed. The above content is for reference only and does not constitute investment advice. MTF Special Analyst Zheng Guangfu
2025-07-30
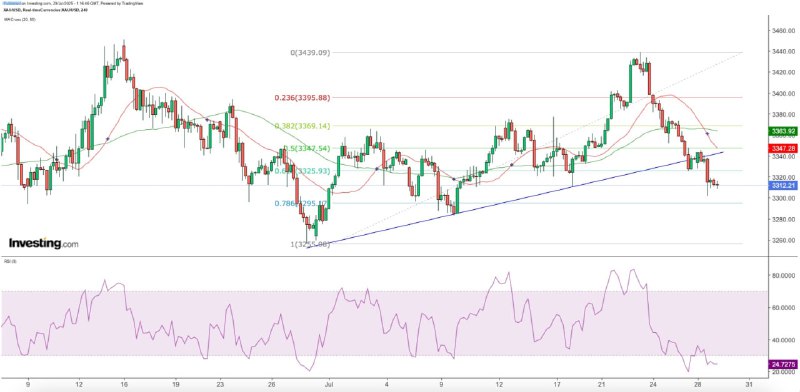
"Gold Price Friend's Final Blow" 29/7 09:12am completed The impact of the framework trade agreement reached between Europe and the United States on the financial market continues to intensify. The S&P 500 index and the Nasdaq Composite Index have reached new highs, the US dollar exchange rate has strengthened, and the Federal Reserve is about to hold an interest rate meeting, which is expected to keep interest rates unchanged. All these factors are unfavorable for gold prices. Yesterday, in the early opening of the European market, the spot gold price reached a high of $3,345 and then fluctuated downward. In the early opening of the New York market, it fell below $3,302 before gradually recovering. In the late opening of the New York market, it approached $3,319, but then fell back again. This morning, in the Asian market, it fell below $3,310 once more. Gold prices are still expected to rebound in the short term The weakening of gold prices was expected. At present, I still maintain the view that gold prices bottomed out yesterday or this Wednesday. Also, once gold prices fall to $3,290, it will meet the 100% expansion of Fibonacci, and a strong rebound is expected at that time. However, the gold price can be said to have reached a critical stage of life and death. As seen from the daily chart, the gold price has once again fallen below the 20-day and 50-day SMA, and the TD upward track has also been lost, showing a short-term downward signal. A strong rebound is necessary in the next two days to rise above the 20-day SMA; otherwise, it will lay the groundwork for a medium-term adjustment. The medium-term decline target is $3,225 As there will be several important data releases in the US this week, especially the employment data, it is necessary to pay attention. As I pointed out earlier, if the data is inaccurate, the chance of the Federal Reserve cutting interest rates will increase. However, this is actually beneficial for funds to continue flowing into the stock market, which is unfavorable for gold prices. From the four-hour chart, it can be observed that the gold price has broken through the upward track since June 28th and disrupted the pattern of one wave higher than the other. The short-term rebound of the gold price should be regarded as an opportunity to escape from short positions. The support at $3,320 turns into resistance, and further upward movement is expected to be restricted at $3,340. The medium-term downward target is $3,225.
2025-07-29
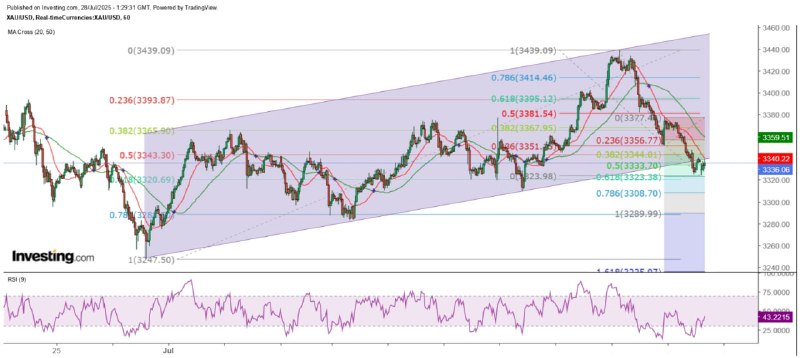
"Gold Price is Expected to be Weak at First and Then Strong This Week" 28/7 10:00am Completed After the United States signed trade agreements with Japan, the Philippines, Indonesia and Vietnam, the market was optimistic about other countries reaching trade agreements with the United States before the high tariff deadline of August 1st. Among them, the United States and the European Union eventually reached a framework agreement. The United States will impose a 15% tariff on imported goods from the European Union, and the European Union will increase its investment in the United States by 600 billion US dollars And to purchase military equipment and energy products worth 750 billion US dollars from the United States. In addition, the United States and China will hold a new round of trade negotiations in Sweden starting today. Trump, as always, has made a statement in advance, indicating that he is very close to reaching a trade agreement with China. On the other hand, market expectations that the Federal Reserve will keep interest rates unchanged after this week's interest rate meeting have put pressure on gold prices. The U.S. July jobs report is expected to deteriorate CME's July gold futures closed at $3,329.1, down 1.24%. Although the spot gold price dropped to $3,325 last Friday, it eventually closed above $3,337, slightly lower than the strong support of $3,340 mentioned last Friday. Although the Federal Reserve is expected to keep interest rates unchanged this week, it is highly likely to hint at considering a rate cut at the remaining meetings of this year. Therefore, gold prices may not sell off further due to the authorities' inaction. On the other hand, the United States will release the ADP private sector job changes, PCE and official employment reports for July from Wednesday to Friday this week. The market expects that the official non-farm payrolls for July will increase by 108,000, lower than 147,000 in June, and the unemployment rate is expected to rise by 0.1 percentage point to 4.2%. All these are favorable for gold prices. Gold prices are expected to stabilize at $3,320 Technically, the spot gold price is at the bottom of the upward channel since June 29th on the hourly chart, and it is also around the 50% retracement level of the largest increase so far that day, at $3,343.3. However, it is expected that the gold price will show a trend of being weak at first and then strong this week. It is anticipated that the gold price will bottom out and rebound today or on Wednesday. If the gold price drops to $3,290, This meets the goal of a 100% expansion of the Fibonacci on the hourly chart. It is expected that a strong rebound will occur at that time. It is estimated that the fluctuation range of gold prices this week will be between $3,290 and $3,365. Spot gold prices rebounded after trying on $3,324 in the early Asian session today, seemingly having digested the outcome of the trade agreement reached between the US and Europe. It is believed that this week the market will mainly focus on the Federal Reserve's interest rate decision and a series of important US economic data. Gold prices are expected to have support at $3,320 within the day, while the resistance for the rebound will be $3,351 and $3,368. The above content is for reference only and does not constitute investment advice. Zheng Guangfu, a special analyst of MTF
2025-07-28
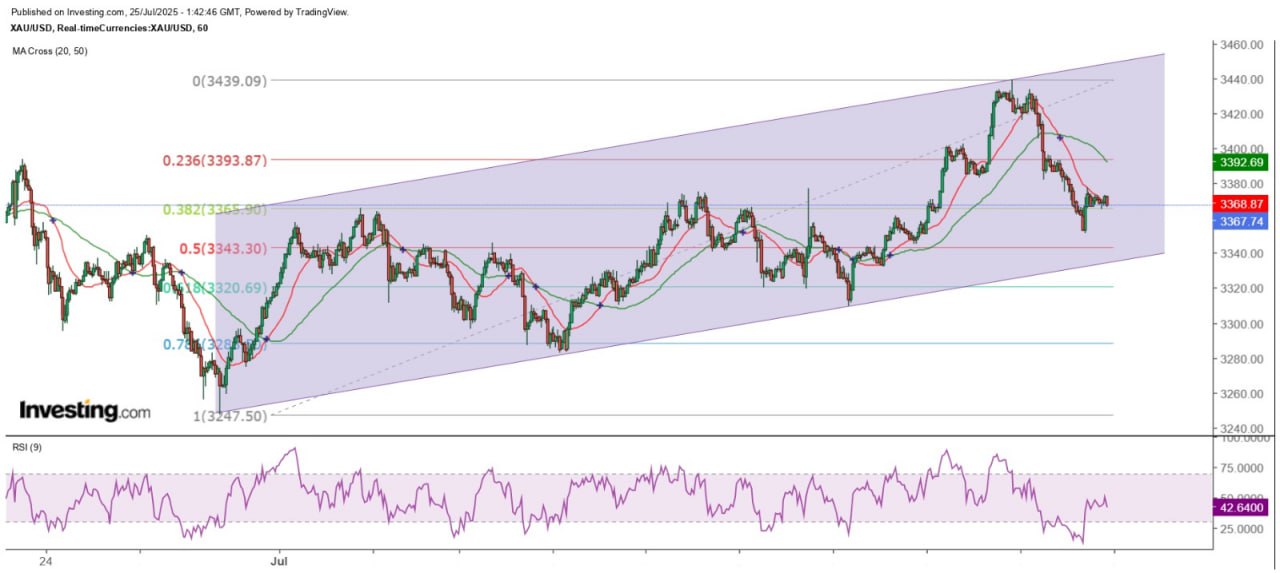
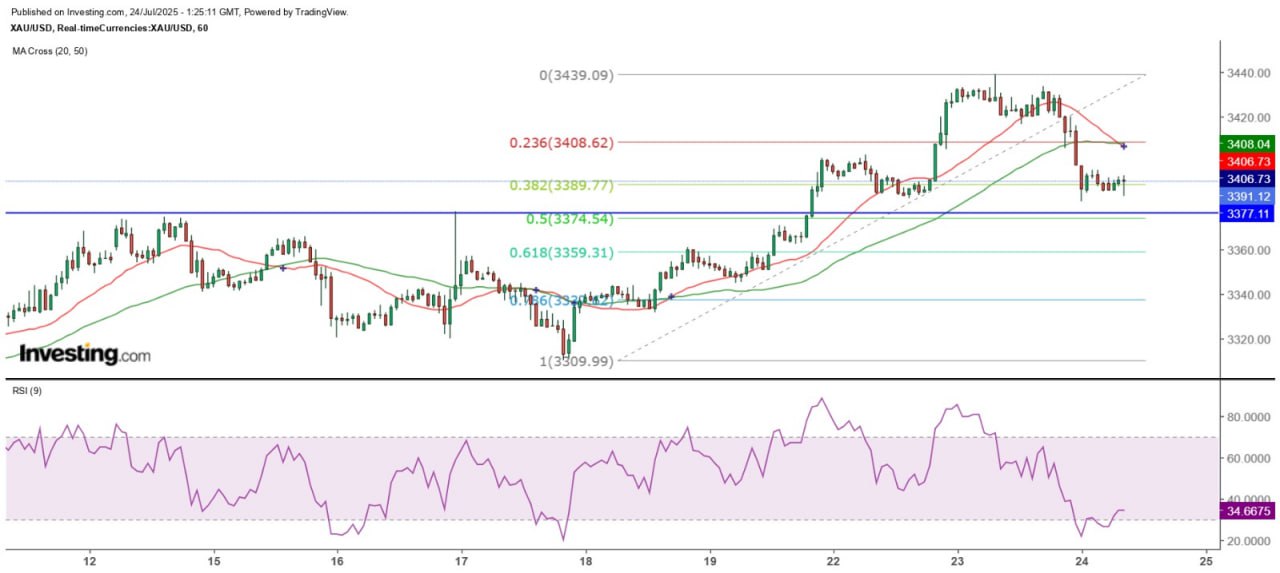
"Gold price at $3,340 likely to be a strong support" 25/7 09:40 am Finalized As the US has reached or is preparing to reach trade agreements with major economies one by one, market risk appetite has expanded. After a two-day reversal on Wednesday, gold prices fell further yesterday, and the decline was larger than expected. Spot gold prices dropped to the $1,335.1 level in the early trading session in New York yesterday, with the cumulative decline from Wednesday's high exceeding 61.8% of the maximum increase from July 17 to 23. As yesterday's closing price was lower than Tuesday's low, the daily chart's bullish and bearish candles once again sent a signal of a downturn. Of course, gold prices are still above the 20-day and 50-day SMAs and maintain the pattern of each wave being higher than the previous one since June 30. Although gold prices may be bearish in the short term, it is not advisable to take heavy short positions. Measured by the TD line, the current gold price on the daily chart still shows an upward tendency, with the target still at $3,520. However, if it breaks through the extended support of the TD ascending track around $3,337 today, the measured decline target will be $3,226. Additionally, the 20-day SMA is at $3,347.5, while the 50-day SMA is at $3,341.6, providing three levels of protection for the gold price. Gold prices are already reflecting the outcome of the interest rate decision next week. The Federal Reserve will hold a monetary policy meeting next week. It is expected to maintain the target range of the federal funds rate at 4.25% to 4.5%. However, the Fed's future monetary policy stance will have a greater impact on gold prices. Judging from the current situation, bears may be able to take advantage of the Fed's decision to keep interest rates unchanged next week to push down gold prices. However, it should be noted that Powell previously hinted that if it weren't for the uncertainty regarding tariffs, the Fed would have cut interest rates. He also said that the impact of tariffs on inflation seems to be less than expected. Nowadays, as the United States and its major trading partners tend to reach lower reciprocal tariffs, Powell may hint at a preference for a rate cut in September and another possible cut in December at the press conference following the interest rate meeting. Looking further ahead, it is highly likely that Powell will not be reappointed when his term expires in mid-May next year, and he is expected to resign as a director. The market will surely view this as a signal of the Fed's shift towards a dovish stance. At that time, funds are likely to flow into risky assets. Whether gold can gain a foothold due to the decline in interest rates remains to be seen. The short-term decline has not constituted a strong reversal. From the hourly chart, the spot gold price bottomed out at $3,351 at the opening of the New York market yesterday and rebounded strongly in a piercing pattern. However, it leveled off at the $3,377 level and has been fluctuating narrowly above $3,365 in the early Asian session today. If we consider the entire upward trend since June 29th, the decline that began from the high of $3,439 on Tuesday has not yet reached 50% of the previous rise (to $3,343.3), slightly above the 50-day SMA. A 61.8% decline would bring it to $3,320.7. Therefore, there is still room for the gold price to fall, but it has not yet formed a strong reversal pattern. If it continues to decline today, it is expected to find support at the $3,340 level. A rebound in the short term would face resistance at $3,395. The above content is for reference only and does not constitute investment advice. MTF Special Analyst Zheng Guangfu
2025-07-25
Gold price has been blocked three times above $3,430 24/7 09:25 am Completed It is reported that the EU and the US are making progress towards reaching a 15% tariff agreement. EU diplomats said that member states may be prepared to accept a 15% tariff rate. EU officials are pushing for this rate to cover industries such as automobiles, but steel and aluminum imports exceeding a certain quota will face a 50% tariff. They also pointed out that although the EU is optimistic about reaching an agreement, they emphasized that the final agreement still depends on the unpredictable US President Trump's decision. In addition, the Japan Broadcasting Corporation quoted a Japanese government official as saying that the United States and Japan have agreed to reduce the tariff on Japanese automobiles to 15%. According to sources, Japan will increase the proportion of rice imported from the United States as part of the trade agreement, but will still maintain the overall framework of the minimum access for rice imports. The upward trend remains unchanged with the closing price holding steady at $3,383. The two major world economies gradually reached trade agreements with the United States, pushing the S&P 500 to a new high, while the Dow Jones and Nasdaq were approaching their historical highs. The safe-haven role of gold weakened, causing a sharp drop in its price. After hitting a low of around $3,381 in London, it rebounded slightly but failed to regain the $3,400 mark, peaking at $3,396. In the early Asian session today, it remained stable above $3,390. From the daily chart, the spot gold price yesterday presented a double-day reversal pattern. It was the third time since early June and early May that it rose above $3,430 but was clearly blocked. Conversely, if the gold price breaks through $3,450 and closes above that level, the possibility of a new high will also increase significantly. In the short term, as long as the gold price continues to close above $3,383, the upward trend since July 9 remains unchanged. Beware of a sharp rebound after testing $3,374.5 From the hourly chart, gold prices have dropped to the bottom of the horizontal range on Tuesday at around $3,380, where support is seen. The cumulative adjustment is over 38.2% of the biggest increase since last Thursday. This is more than $7 away from the strong support level of 50% retracement at $3,374.5 mentioned yesterday. Optimistically, gold prices are expected to hold above $3,385 for consolidation within the day. Even if they test $3,374.5, it is expected that there will be strong support at this level, leading to a significant rebound and ultimately forming a favorable long-tailed hammerhead pattern on the daily chart. However, gold prices must not close below $3,383 on the daily chart. Otherwise, the market is likely to test the 20-day and 50-day SMAs at $3,343 and $3,383 respectively before a potential rebound. The main resistance for the intraday rebound is at $3,405 and $3,410. The above content is for reference only and does not constitute investment advice. MTF Special Analyst Zheng Guangfu
2025-07-24
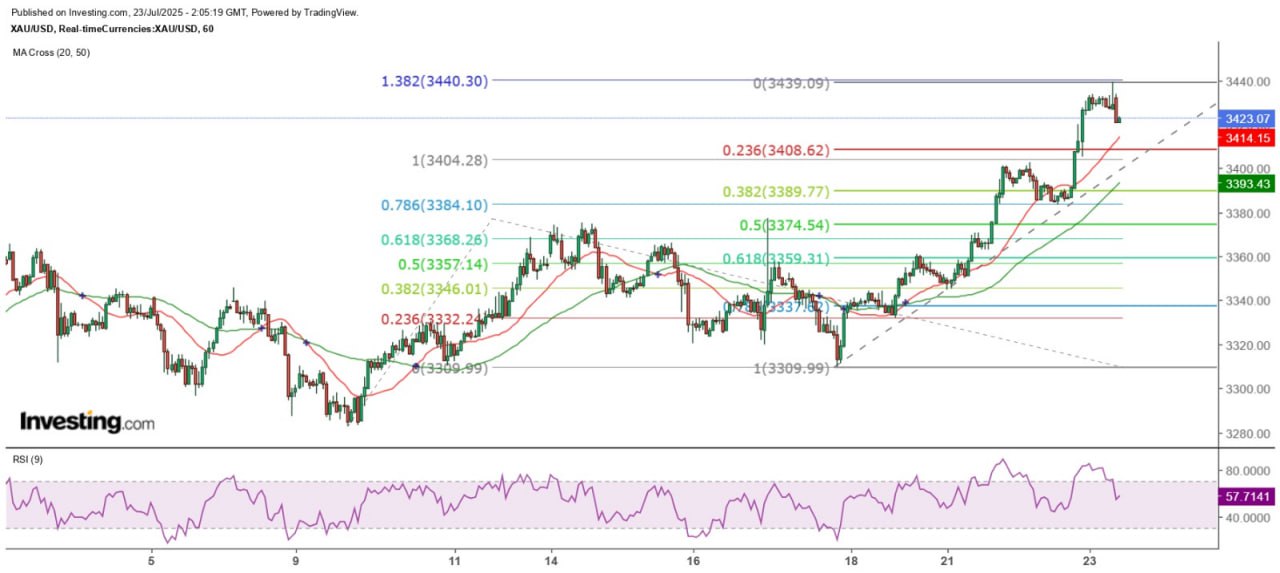
"Gold Prices Expected to Enter a Short-Term Correction Phase" 23/7 10:02 am Completed Gold prices soared at the opening of the New York market yesterday, breaking through the Asian market high of $3,402 for spot gold. The upward trend continued and reached a high of around $3,430 before the London market closed. The reason for this is related to whether Powell can remain as the chair of the Federal Reserve until May next year. US Treasury Secretary Mnuchin and President Trump are in cahoots. Although the former said there is no sign that Powell should resign now, it would be acceptable if he wanted to leave early; the latter "predicted" that Powell would soon leave and that the federal funds rate should be reduced to 1%. The remarks of both sides once again served as an excuse for the market to sell off the US dollar. Although the gold price closed below $3,386 on the hourly chart in the midday Tokyo session yesterday, showing a short-term bearish signal, it only dropped to $3,383 at the opening of the European market and then returned to a low-volatility sideways pattern. Its strength really surprised me. This morning, the gold price further rose to a high of $3,439. As the gold price is getting closer to the June 16th high of $3,451, it should be expected to challenge that level. However, the gold price is likely to form a short-term top today. From the hourly chart, after reaching a high of $3,439 this morning, the gold price formed a shooting star pattern, indicating resistance at $3,440. Subsequently, it showed a high open and low close pattern with a broken foot, and fell back to the $3,422 level. As the bearish signal has emerged, the possibility of a top and a pullback today has increased significantly. 3374.5 has strong material support. Measured by Fibonacci extension levels, the high this morning was just $1 away from the 1.382 level at $3,440.3, indicating that the target has been reached. Assuming that gold is about to enter a short-term correction, a 50% retracement of the largest increase since July 17 would bring the price down to $3,374.54, close to the July 14 high of $3,375.02, which can be regarded as an important support level for this correction. If a large range of bearish engulfing pattern appears on the hourly chart during the period when gold attempts to break through $3,451 again, the possibility of a short-term double top formation and subsequent decline will increase. The above content is for reference only and does not constitute investment advice. MTF Special Analyst Zheng Guangfu
2025-07-23
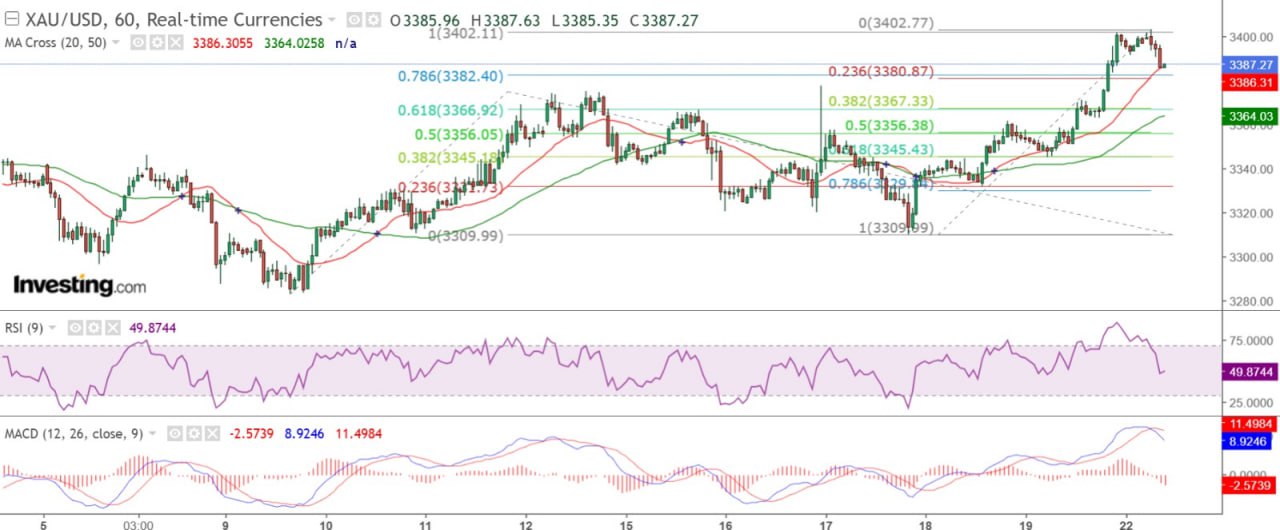
"Gold Price's Short-Term Uptrend Comes to an End" 22/7 10:16 am Finalized Yesterday, the spot gold price rose strongly, reaching as high as $3,401 in the early New York market, which can be said to have exceeded expectations. The main reason for the significant rise in the gold price and the sharp drop in the US dollar exchange rate is believed to be related to Powell. According to the report by The Ho Report, US Representative Anna Paulina Luna has filed criminal charges with the Department of Justice, claiming that Federal Reserve Chair Powell gave false testimony twice. Luna said that Powell made several major false statements when testifying before the US Senate Committee on Banking, Housing, and Urban Affairs on June 25 regarding the renovation of the Federal Reserve's Eccles Building. This makes one wonder if Trump is using someone else's hand to find an excuse to fire Powell or force him to resign as the chair of the Federal Reserve, and then introduce a more compliant candidate to take over the Federal Reserve to achieve his wish of cutting interest rates! From the daily chart, the spot gold price broke through the higher-level TD downtrend line yesterday, with the measured target at around $3,520. Even though I remain cautious about whether the gold price can maintain its strong momentum in the future, technically, the spot gold price is expected to reach a new historical high. However, investors should still be aware that after a sharp rise yesterday, the gold price often consolidates. After further rising to the $3,402 level in the Asian market this morning, it pulled back to the $3,390 level. Personally, I believe that the gold price will consolidate within the range of yesterday's fluctuation this week, that is, between $3,344 and $3,401, and then attack the $3,500 level. $3,356 is expected to be a strong support. On the hourly chart, observing the price movement since July 9th, the gold price touched $3,402.77 this morning, slightly exceeding the 100% Fibonacci extension level of $3,402.11. In other words, the upward trend since July 9th is likely to come to an end. The gold price is expected to further consolidate and adjust in the short term. After reaching a high of $3,402 this morning, the gold price has started to decline and formed a bearish engulfing pattern. If the gold price closes below $3,386 on the hourly chart, it indicates a further decline. In the short term, the target is the 50% retracement of the largest increase since July 17th near $3,310, which is $3,356. Only then is it expected to stabilize. The significant adjustment in gold prices is a response to the rally since July 9th, with the main support being a pullback to half of the rise during that period. This means that gold prices have the potential to fall to $3,342.8. Given the strong performance of gold prices yesterday, it is expected that $3,367 will be the first strong support level, while $3,356 will be the next stronger support level. However, if gold prices break through the previous high, the next target for a challenge will be $3,451. Nevertheless, gold prices turned around and fell on the same day after reaching this level on June 16th, so it is believed that this level will be extremely resistant. The above content is for reference only and does not constitute investment advice. MTF Special Analyst Zheng Guangfu
2025-07-22
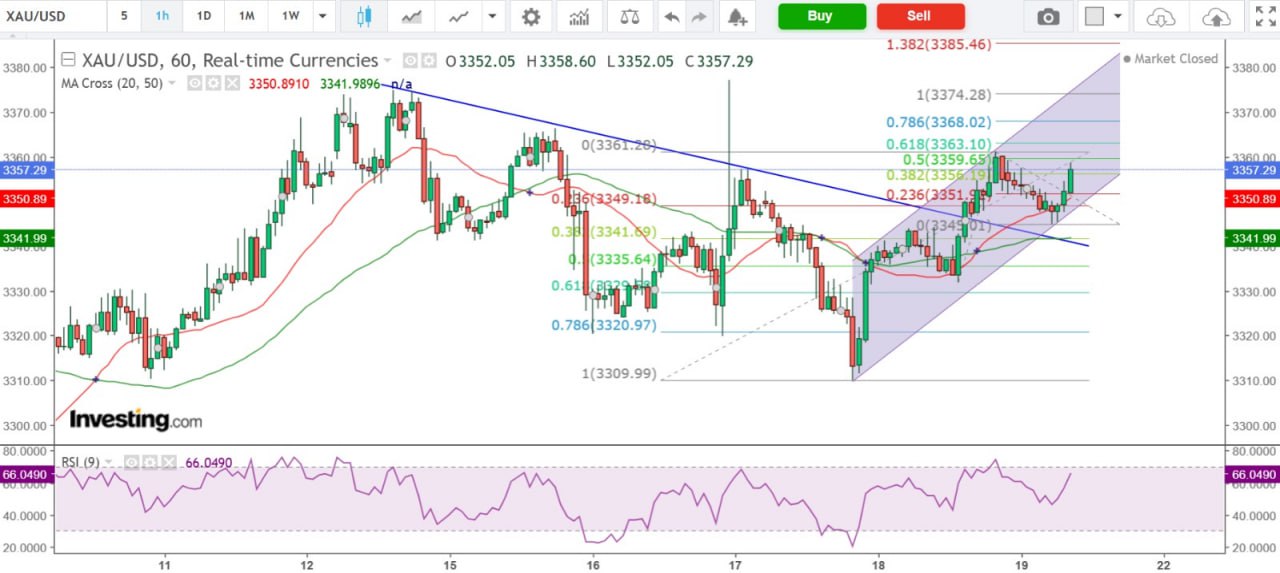
Gold prices are expected to challenge $3,375 again. 21/7 10:00 am Completed. Gold prices last week generally followed a pattern of falling first and then rising. The settlement price of the CME's main August gold futures contract was $3,358.3 per ounce, up $13 or 0.4%. The last trading price was $3,355.5. Spot gold closed at around $3,350. Although gold prices recovered most of their losses in the last two trading days of last week, for the entire week, after rising for two consecutive weeks, gold prices closed lower last week. The holdings of the SPDR Gold ETF changed only on three days last week. Although it increased by 3.15 tons on Wednesday, it reduced by a total of 7.17 tons in the following two days, resulting in a net reduction of 4.02 tons to 943.62 tons for the entire week. Tariff agreements remain the main cause of gold price fluctuations. As countries are still striving to sign trade agreements with the United States before August 1st, it is expected that the gold price will continue to fluctuate in response to the gradually released agreement results before that date. A clearer trend is likely to emerge after August 1st. On the other hand, US President Trump has been constantly criticizing Federal Reserve Chair Powell's monetary policy and even pressuring for his dismissal. However, so far, there has been no concrete action. Therefore, unless the position of the Federal Reserve Chair is actually going to change, this incident will only cause short-term volatility in the gold price and even the financial market. In terms of geopolitics, Trump assured Ukraine that it would be provided with advanced weapons to counter Russia. Additionally, he imposed sanctions on Russian oil and threatened to impose secondary tariffs of up to 100% on countries purchasing Russian oil. I believe the aim is to force Russia to end the conflict with Ukraine as soon as possible, rather than, as some market analyses suggest, reigniting the conflict between Russia and Ukraine. The $3,351 level in gold prices is expected to form a double top neckline. As for the gold price, after the spot gold price broke through the TD downtrend line on July 11th, the pullbacks from last Tuesday to Thursday did not form an effective bearish signal. Therefore, the medium-term target remains at $3,474. From the hourly chart, the gold price has also broken through the downtrend line since July 14th. Hence, the immediate adjustment is expected to hold above the extension support of the upward trend line (approximately $3,342). Gold prices rebounded after hitting a low of 3,351 in the early Asian session this morning, coming close to 10 dollars short of the 38.2% retracement level of 3,341.69 dollars from last Thursday to Friday's biggest gain. This indicates that gold prices still maintain a strong upward momentum. If it breaks through last Friday's high of 3,361.28 dollars and holds above it, it is expected to rise to 3,374.28 dollars before a significant correction. If the attempt fails, it is likely to fall back in a small double top pattern, with 3,351 dollars as the first target for testing the neckline. If it breaks below, the measured target of 3,340.74 dollars will be tested. Another possibility is that if gold prices break through 3,361.28 dollars but are blocked at the July 15th top of 3,366 dollars and show a divergence with the 9-day RSI, it will fall back. In that case, 3,351 dollars will still be an important support level for the double top neckline. The above content is for reference only and does not constitute investment advice. MTF Special Analyst Zheng Guangfu
2025-07-21
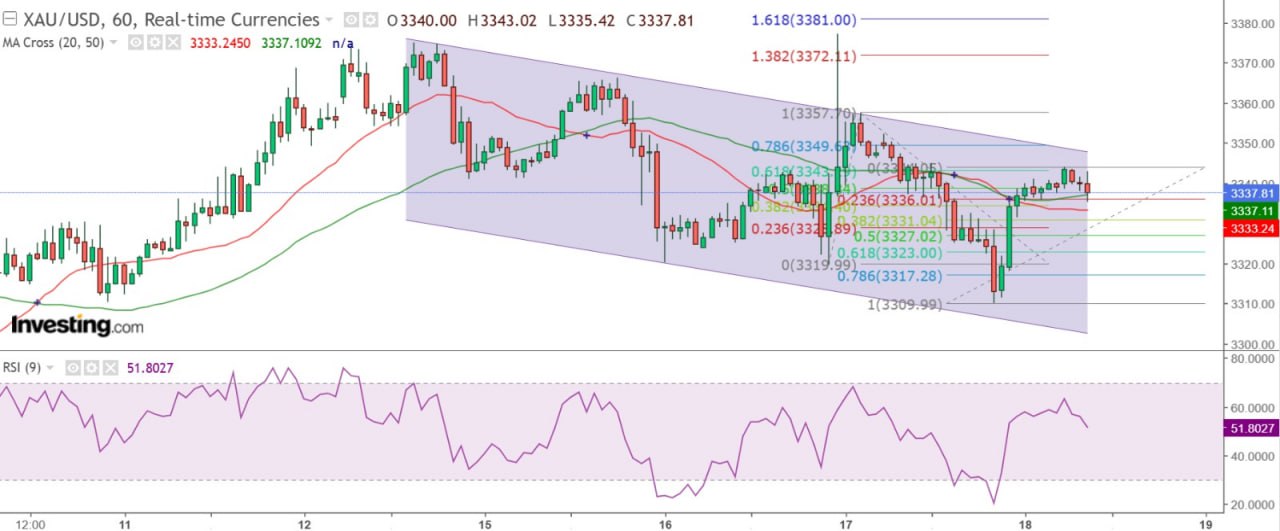
"Gold Price May Hit Short-Term Cycle Bottom" 18/7 09:47 am Completed Gold prices have recently been largely responding to the performance of US economic data. Yesterday, the US released June retail sales data that was better than expected, with a monthly increase of 0.6% and an annual growth rate expanding to 3.9%, providing an excuse for bears to sell off gold. However, after falling to $3,310, spot gold prices rebounded sharply and continued to climb to a high of $3,341 in the New York afternoon session, eventually closing at $3,340. Therefore, from the daily chart perspective, there is no effective signal of a decline in gold prices. There is a maximum of 1.25 percentage points of room for the US interest rate to be cut. Yesterday, the president of the San Francisco Federal Reserve Bank, Daly, said that two interest rate cuts this year are a reasonable expectation. When asked about the possibility of a rate cut in July, he said that whether it is in July or September is not the key point; the issue lies in the future trend, that is, the interest rate will decline as inflation drops, but he emphasized that the interest rate will eventually stabilize at 3% or higher. In other words, the Federal Reserve has at most a 1.25 percentage point room for rate cuts in this rate-cutting cycle, of course, depending on the performance of inflation. On the other hand, Federal Reserve Governor Waller stated that the Federal Reserve should cut interest rates by 25 basis points at the July meeting and said that there is nothing wrong with taking preventive rate cut measures. A rate cut in July might provide the Federal Reserve with room to keep interest rates unchanged at the next few meetings, and he also indicated that he would vote in favor of a rate cut at the July meeting. The intraday adjustment range of gold prices is expected to narrow. The gold price has only shown fluctuations without any breakthrough on the daily chart. From the hourly chart, the gold price is still in the downward trend since July 14th. However, it should be noted that the gold price is likely to reach the bottom of the short-term cycle today. Therefore, it is unlikely to experience a break below the bottom as in the past few trading days. Even if there is a pullback within the day, the extent of the adjustment will be at most from yesterday's low to the 50% retracement level of the maximum increase so far, which is approximately $3,327. Even a 38.2% pullback to the $3,331 level will find support. If the gold price drops to the above-mentioned level, it can be regarded as a buying opportunity. Conversely, if the gold price consolidates at a high level and then breaks through the Asian morning high of $3,344, following the trend and entering the market is also a strategy, with the targets at $3,357 and $3,372. In any case, the current gold price still takes $3,321 as an important support level. A close below this level on the daily chart will be regarded as a signal of a downturn. The above content is for reference only and does not constitute investment advice. MTF Special Analyst Zheng Guangfu
2025-07-18
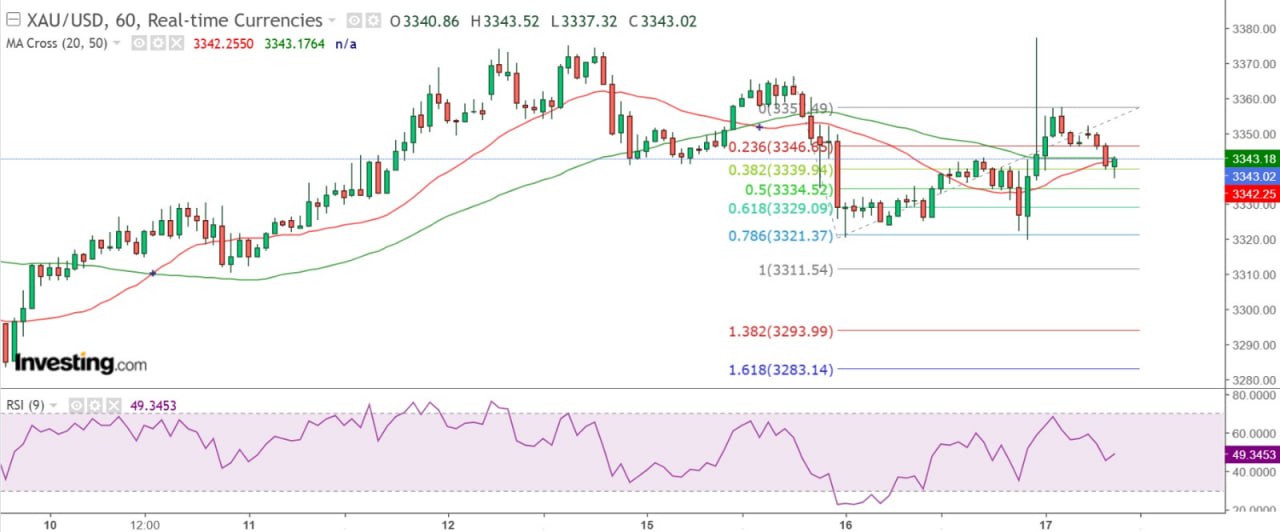
"Gold Market Bulls Take the Lead for Now" 17/7 09:47 am Finalized Yesterday, the gold price's reaction to the US June PPI data was not as strong as its response to the CPI. The year-on-year increase in both the overall and core PPI in June was significantly smaller than that in May. The overall PPI rose from 2.7% to 2.3%, and the core PPI from 3.2% to 2.6%. On a monthly basis, there was no change. Why did the CPI increase in June, but the PPI decrease? The Bureau of Labor Statistics pointed out that the main reason is the difference in sampling. The PPI includes all products sold by domestic producers to households, but the CPI includes goods and services provided by businesses and the government to consumers. For example, rent, which accounts for the largest proportion in the CPI, is not included in the PPI. Additionally, the CPI includes imports, but the PPI does not. The CPI only includes personal consumer goods directly paid for by consumers, while the PPI includes consumer goods that consumers may not have paid for. Trump wants to force Powell to resign. Although the gold price did not react much at the beginning of the release of the PPI data, it still followed the expected pattern of falling first and then rising. The reason for this might be related to the fact that US President Trump is considering removing Federal Reserve Chair Jerome Powell from his position. According to CBS, several people directly familiar with the matter revealed that when Trump asked some Republican congressmen on Tuesday whether he should fire Powell, all of them agreed. However, according to federal law, there must be a "reasonable cause" to remove the chairperson of the Federal Reserve, so it is questionable whether this can be done, and even if it is carried out, it is likely to face legal challenges. Trump has repeatedly publicly criticized Powell's monetary policy in this way. I think it is a provocation, aiming to make Powell realize the difficulty and step down voluntarily. This would be exactly what Trump wants. But if Powell ignores it, Trump will have no way out! Yesterday, the gold price gradually weakened to $3,319.78, very close to the first key support level of $3,319.50 mentioned yesterday. It then sharply rose to a high of $3,377 before falling back and rebounding. However, it was blocked again at the $3,357 level. In the early Asian session today, it stabilized above $3,340. Analyzing the gold price trend from different timeframes, the monthly chart shows an upward trend, but the 9RSI is still as high as 90. The weekly chart shows a bearish candlestick pattern, while the daily chart shows an upward trend, but the 20-day SMA is gradually moving down towards the 50-day SMA. The key level remains at $3,321, with $3,282.80 as the next important support level. Resistance levels are at $3,365.80 and $3,400. Therefore, the current major trading range is between $3,321 and $3,400. The short-term upward opportunity for gold prices is relatively large. From the hourly chart, $3,321 is a key support level for the day. Based on the Fibonacci extension of 100%, gold has the potential to fall to $3,311.54 before rebounding significantly. However, if it closes above the July 11 low of $3,321.27, the upward development pattern remains unchanged. Especially since yesterday, gold broke through $3,375 strongly but did not break through $3,320, indicating a stronger upward intention. Therefore, it is expected that gold will fluctuate between $3,321 and $3,360 on the day. The above content is for reference only and does not constitute investment advice. MTF Special Analyst Zheng Guangfu
2025-07-17
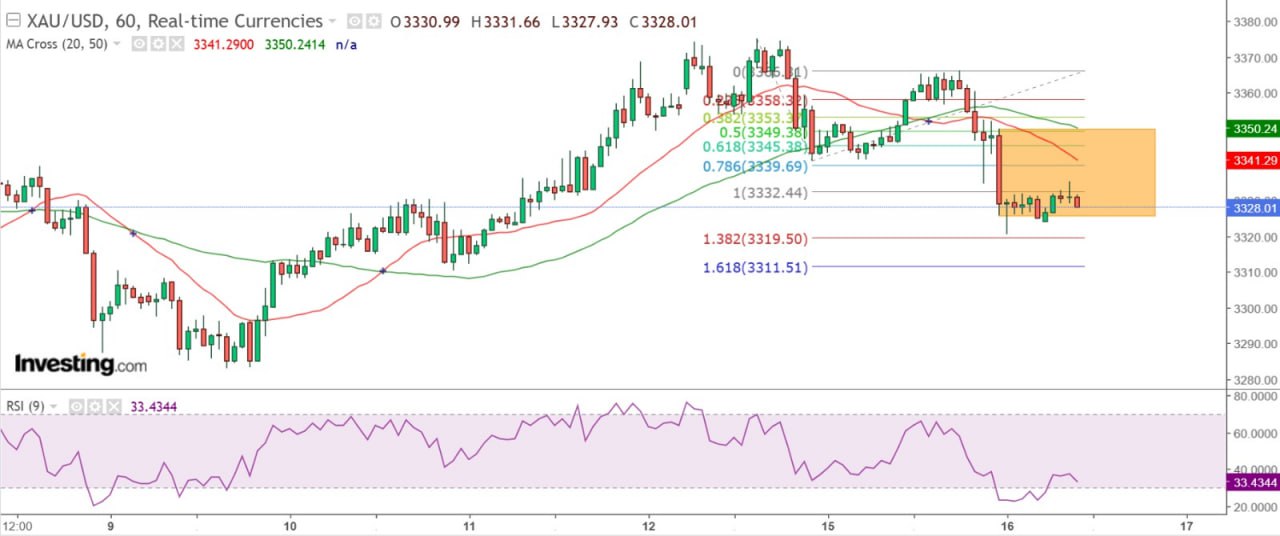
"Gold Prices: Beware of a Dip Before a Rebound" 10:05 am, July 16th, Completed Yesterday, the US released its June overall CPI, which rose by 2.7% year-on-year after seasonal adjustment, higher than the 2.4% increase in May and the expected 2.6%. The core CPI, excluding food and energy, also rose by 2.9% year-on-year, slightly lower than the expected 3%. The US inflation rate has risen for two consecutive months, boosting the US dollar exchange rate. Major non-US currencies plunged sharply. The euro and the pound sterling against the US dollar both dropped nearly 100 points from their post-data highs before stabilizing. The US dollar against the Japanese yen rose more than 130 points from its post-data low and once broke through 149. Gold prices were naturally under pressure, with spot gold prices falling to the 3320 US dollar level before rebounding slightly, down 46 US dollars from the day's high of 3366 US dollars. However, gold prices tested $3,341 in the early Asian session yesterday but failed to break through. They then rose steadily and reached $3,365 in the Tokyo midday session. Even after the European markets opened, they remained consolidated at high levels and later rose as high as $3,366. Investors may be puzzled. With expectations that US inflation is likely to rise in June, the Federal Reserve is unlikely to cut interest rates this month, which should be unfavorable for gold prices. So why did gold prices still rise? Going with the flow is the way to survive. It should be known that the financial market gathers various types of speculators. Take the gold market as an example. There must be those who have made preparations for high inflation in advance, that is, they have bought the US dollar or sold gold before the data is released. This becomes the reason for the invisible hand to first kill the short positions of gold and then the long positions. The trigger of a large number of gold short positions to stop losses will become one of the driving forces to push up the gold price, reducing the profit cost of the major players. If the US CPI inflation rate in June unexpectedly drops, the market can also use the reason that the increase in the gold price has already reflected the relevant result to push the gold price down from the high level in the opposite direction. Investors should not argue about right and wrong or try to seek the truth in the financial market. Going with the trend is the way to survive! The upward trend of closing at 3321 remains unchanged. Although the gold price showed a single-day reversal pattern yesterday, as pointed out yesterday, as long as it closes above $3,321, the medium-term upward trend remains unchanged. Today is the third trading day after the gold price broke through upward. Currently, the gold price is closer to the support level. Tonight, the US will release the June PPI data, which is expected to reflect rising production costs. Be cautious of a further decline in the gold price. However, the current gold price is closer to an important bottom support. Unless the gold price is preparing for a major downward breakthrough, the rebound space for the gold price is relatively large. For the spot market, if the gold price closes above $3,332 on the hourly chart, it is expected to rebound further intraday, but it is likely to be blocked at the top of the large bearish candle at $3,351. Based on the Fibonacci expansion ratio of 1.382 and 1.618, the key intraday support levels for gold are at $3,319.5 and $3,311.5. If the gold price drops ahead of the PPI data release, be cautious of a significant rebound after the data release. The above content is for reference only and does not constitute investment advice. MTF Special Analyst Zheng Guangfu
2025-07-16
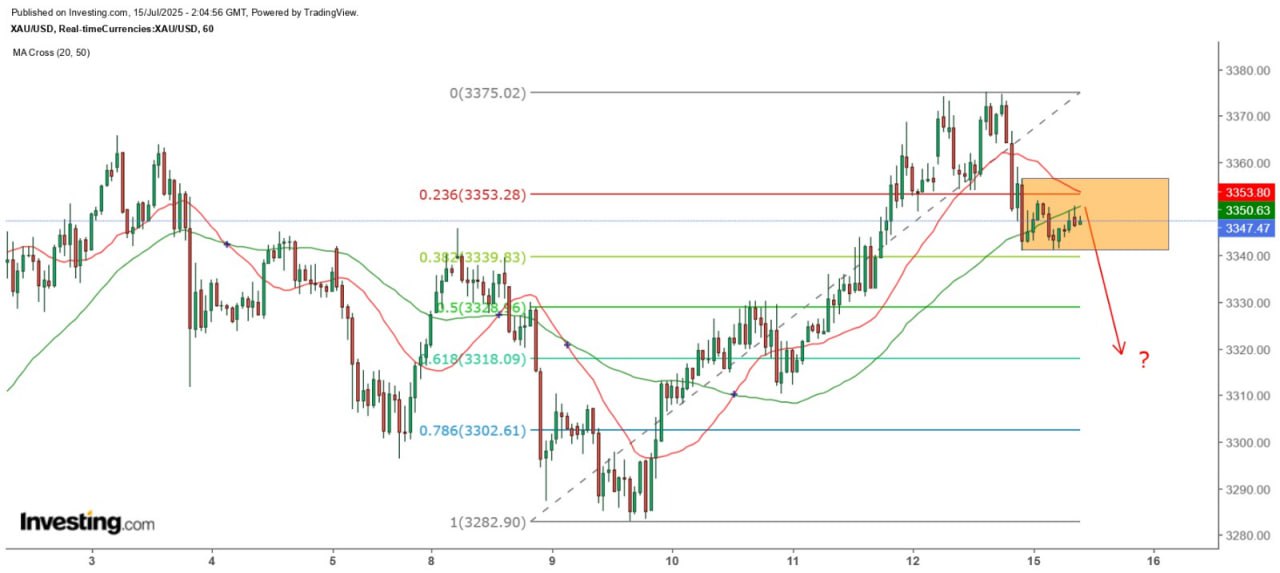
"Gold Price at $3,321 Must Not Be Lost" 10:02 am, July 15, 2023 Completed Yesterday, Trump told NATO Secretary General Mark Rutte that if Russia fails to end the Russia-Ukraine conflict within 50 days, the US will impose severe financial sanctions on it and will impose a 100% secondary tariff, but did not disclose the details. It is not clear whether this includes retaliatory tariffs or additional tariffs. However, the term "secondary tariff" was previously used by the Trump administration to describe punitive tariffs imposed on third parties that trade with countries hostile to the US. In other words, this is a tariff in addition to retaliatory tariffs, mainly targeting countries that purchase Russian crude oil. If this approach eventually leads to the end of the Russia-Ukraine conflict, the role of gold as a safe haven during wars will diminish, and the gold price will inevitably come under pressure. On the other hand, the US will release the June CPI tonight. It is expected that the overall year-on-year increase will expand from 2.4% to 2.6%, and the core CPI year-on-year is also expected to increase from 2.8% to 3%. The rise in inflation will naturally make the market more convinced that the Federal Reserve will not cut interest rates at the end of this month. Whether it has the ability to cut interest rates in September, of course, also depends on future inflation performance. The opportunity cost of holding gold is not insignificant. Investors may ask, doesn't gold have an anti-inflationary effect? Why is it not expected to rise? It should be noted that even though the federal funds rate has dropped by 1 percentage point from last year's peak to the current 4.25% to 4.5%, it is still the highest level since the 2000 financial crisis. The real interest rate is also about 2%. Just from the perspective of interest, the opportunity cost of holding gold is 2%. Will investors give up the 2% return they can get from holding the US dollar and continue to hold gold? If US inflation slows further, gold cannot appreciate on the grounds of anti-inflation. In other words, the development of gold prices depends entirely on how investors view the prospects of the Russia-Ukraine war and inflation. Gold prices gapped higher yesterday. In the early Asian session, they rose to a high of $3,374 before fluctuating. Although they climbed to $3,375 in the early European session, selling pressure increased significantly. After rising to $3,374 in the midday session, they failed to break through $3,375 and plunged sharply. They hit a low of $3,341 in the early New York session before gradually stabilizing. From the daily chart, $3,321 is a short-term indicator for judging whether gold prices can continue to rise. If they close above this level, there is still hope for further gains. However, if they close below this level, gold prices will face downward pressure again. The gold price may fall to $3,318 within the day. From the hourly chart, gold prices show a more downward trend. After three large bearish candles appeared in New York yesterday, the price rebounded but failed to challenge the top of the last bearish candle at $3,356. The current important support level is at $3,341. If the price closes below this level on the hourly chart, gold prices are expected to fall further. In the short term, gold prices are likely to range between $3,341 and $3,356. An upward break could lead to another challenge of $3,375, but this level is expected to offer significant resistance. If there is a downward break, gold prices are likely to fall to $3,329 or even $3,318 before stabilizing. Even so, as long as the daily chart closes above $3,321, the medium-term upward trend remains unchanged. The above content is for reference only and does not constitute investment advice. MTF Special Analyst Zheng Guangfu
2025-07-15
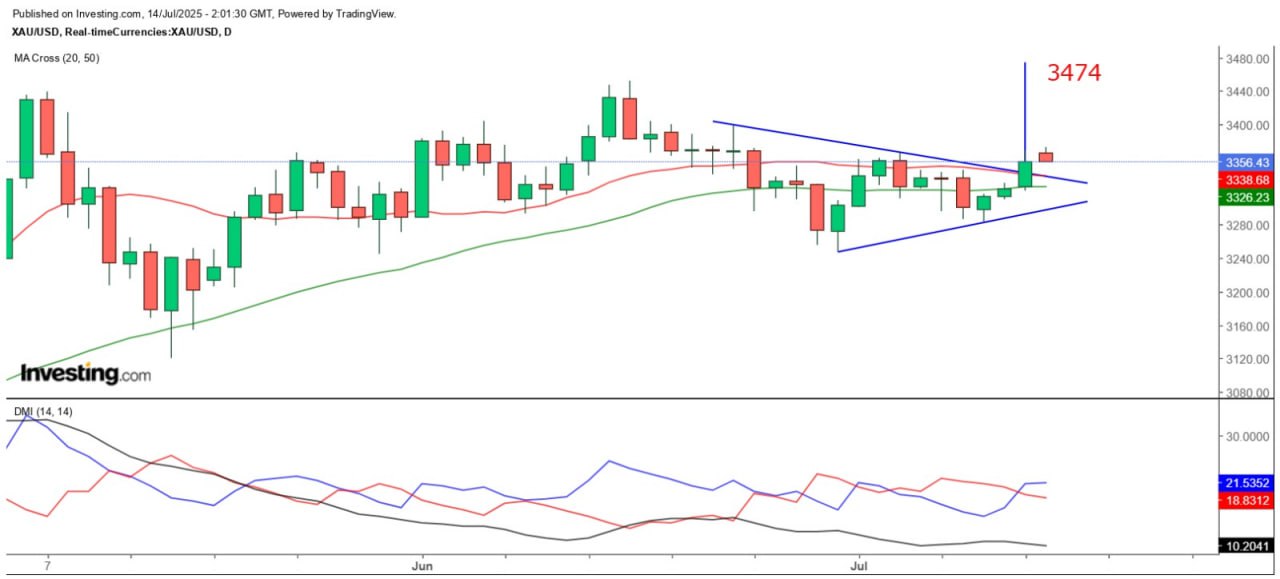
Gold prices are expected to rise further. 14/7 10:10 am Completed. Gold prices reversed their recent decline last Friday, reaching as high as $3,369, far exceeding my expected resistance level of $3,350. However, they eventually closed at $3,355. Is this the beginning of a new upward trend for gold prices, or is it merely a release of accumulated energy, with stop-loss orders and new buying pushing prices up before returning to a sideways pattern? Last Friday, Trump announced that the United States would impose a 35% import tariff on Canada and Mexico, and a 30% tariff on Mexico and the European Union. If the three parties take countermeasures, the United States will impose additional tariffs on the relevant rates. On the other hand, the market suddenly reported that Federal Reserve Chair Powell was considering resigning. If this is true, investors may think that the successor will surely comply with Trump's request and take interest rate cut actions, which is beneficial to gold prices. However, another scenario may occur. If the successor lowers short-term interest rates, investors may think that in the current US economic and employment situation, it is very likely to push up inflation, and long-term interest rates will rise, which is unfavorable to gold prices. Gold prices are expected to consolidate above the 20-day moving average. Technically, gold closed above the July 8 high of around $3,346 and the 20-day SMA ($3,338.8) on the daily chart last Friday, and clearly broke through the TD supply line (downward track). The measured upside target is approximately $3,474. As this is a preliminary upward break, the 14-day average directional index (ADX) has not shown a clear upward trend yet. Although the +DMI has broken above the -DMI, it has been entangled frequently in recent times. However, if gold can close above the 20-day SMA and the TD supply line for at least three consecutive trading days, it will further confirm the upward trend. Silver prices hit a new high; cautious optimism prevails. Gold prices opened sharply higher in the Asian session this morning, reaching a high of $3,373. The 38.2% retracement target of $3,339 since July 9th can be regarded as the first important support level, which is also slightly above the 20-day SMA. If gold prices are once again dominated by bulls, they should consolidate above the 20-day SMA before launching another offensive. Short-term trading is more favorable for buying on dips, with $3,339 as the support level and the short-term target at $3,401. Additionally, silver prices also reached a new high of $38.64. The short-term outlook is cautiously optimistic, but if it closes below $38.40 on the hourly chart, long positions should be taken off. The first important support level for silver is $37.90. The above content is for reference only and does not constitute investment advice. MTF Special Analyst Zheng Guangfu


