
 en-US
en-US 

 Telegram
 WeChat

2025-07-14
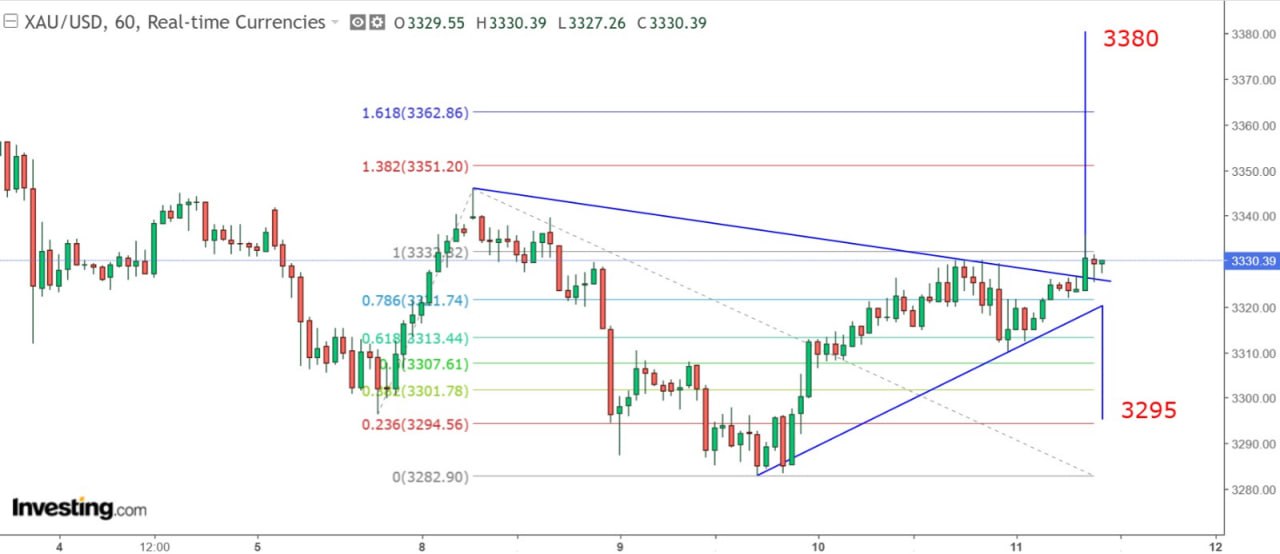
Gold prices are expected to challenge the $3,350 mark in the short term. 11/7 10:08 am Completed. The United States' trade negotiations with various countries are still ongoing. The United States has imposed a reciprocal tariff of 50% on Brazil, which is the highest so far. Additionally, the United States has also imposed a 35% reciprocal tariff on its neighboring country, Canada. Trump stated that only Canadian enterprises that set up factories in the United States can be exempted from the 35% tariff. He further promised to expedite the relevant approval process within a few weeks. However, he also warned that if Canada takes retaliatory measures by imposing additional tariffs, the United States will double the existing tariffs. As there were no significant economic data releases in the US this week, the gold price slowly rebounded after a sharp drop on Tuesday. The spot gold price was held back at $3,330 as expected yesterday and eventually closed at the $3,323 level. However, in the early Asian session today, the spot gold price rose sharply to $3,336, then quickly retreated and is currently hovering around the $3,330 level. It is estimated that this is due to the US and Canada raising reciprocal tariffs, which has once again raised market concerns. The gold price took advantage of the quiet trading in the early Asian session to catch the bears off guard. From the trend, the possibility of a further short-term rise in the gold price has increased. The daily chart still shows a descending flag pattern. From the hourly chart, it can be observed that the price broke through the resistance of the downtrend channel this morning. The measured upward target is $3,380. Conversely, if the price breaks down, the current measured downward target is $3,295. As time goes by, the downward target will only be higher, not lower. Additionally, investors should still note that the daily chart of gold is currently in a descending flag pattern. The price must close above the high of around $3,346 on Tuesday this week to have a chance to reverse the decline since June 16th. In the short term, if the gold price closes below $3,323.65 on the hourly chart, it can be regarded as a preliminary signal of a decline. The target for the fall is $3,310. Moreover, the cumulative rebound of the gold price since the beginning of this month has slightly exceeded the Fibonacci 100% extension level of $3,332, indicating a potential downward risk. If the cumulative increase reaches 1.382 times, the gold price could reach $3,351.2, slightly higher than the high of around $3,346 on Tuesday this week. Therefore, it can be inferred that even if the gold price continues to rise, the upward trend is expected to be blocked around $3,350. Optimistically speaking, the gold price is expected to fluctuate between $3,320 and $3,350 in the near term. The above content is for reference only and does not constitute investment advice. MTF Special Analyst Zheng Guangfu
2025-07-11
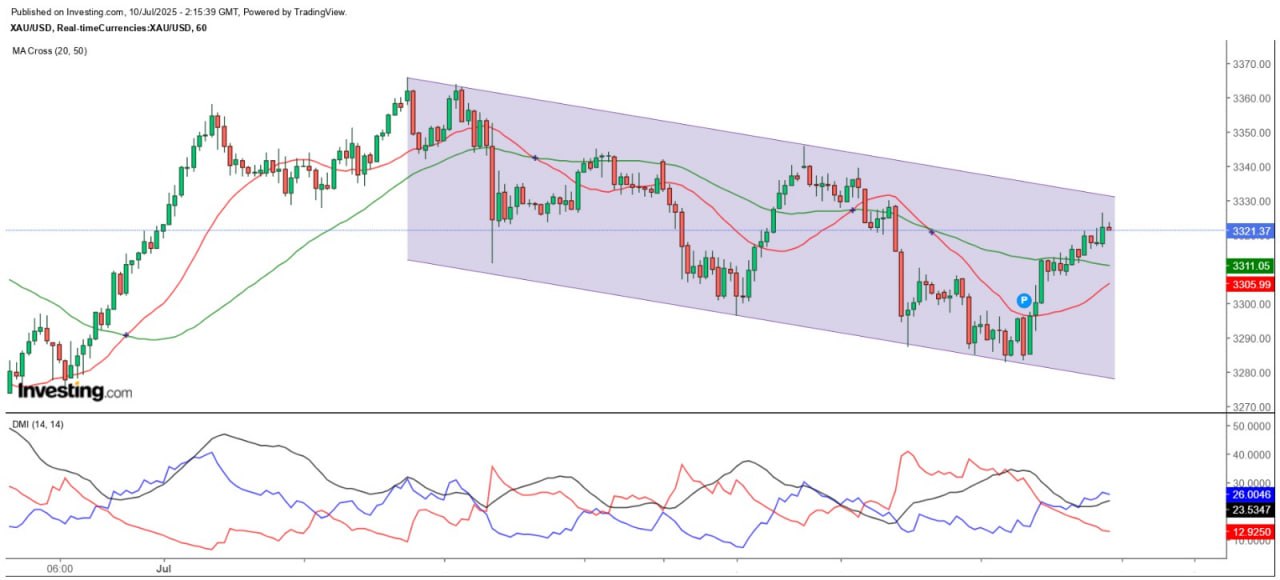
"Gold Price Maintains Repeatedly Falling Pattern" 10/7 10:15 am Completed Yesterday, Trump sent tariff letters to six countries including the Philippines, Moldova, Brunei, Algeria, Libya and Iraq, with the highest rate reaching 30%. Trump said that the tariffs on goods from Moldova, Iraq and Libya were lower than those announced in early April, while the rates on goods from the Philippines and Brunei were higher. As Trump made it clear that he would not extend the August 1 trade agreement deadline, India is in serious negotiations with the US to reach a trade deal, and EU officials are also in talks with the US to seek a balanced agreement. In addition, Trump warned that BRICS countries would face an additional 10% tariff, and he also threatened to impose a 50% tariff on copper products and a 200% tariff on imported drugs. The chance of the Federal Reserve cutting interest rates in July is slim. In addition, the minutes of the US Federal Reserve's June monetary policy meeting released yesterday showed that the impact of tariffs on inflation was the reason for the officials' divergent views on the interest rate outlook. A few officials supported a rate cut in July, while most were concerned about the inflationary pressure brought by the tariff policy. Some even believed that there was no need to cut interest rates this year. The minutes also showed that the participants believed there was "considerable uncertainty" about the timing, magnitude and persistence of the impact of tariffs on inflation. Although a few participants pointed out that tariffs would lead to one-off price increases and would not affect long-term inflation expectations, most participants believed that tariffs could have a more lasting impact on inflation. Moreover, some officials also believe that the current inflation is still far from the 2% target - even without the tariffs having a greater impact in the coming months, it is not enough to support a rate cut. Records show that some policymakers indicated that they were willing to consider supporting a rate cut at the July meeting, and most policymakers believed that a moderate rate cut this year might be appropriate. The 50-day moving average remains a significant resistance. After the gold price broke through the $3,300 mark yesterday, it did not plummet as expected to $3,258. Instead, it stabilized at $3,280 and continued to rise. By the early Asian session today, it had returned above $3,325. However, from the hourly chart, the gold price is still in a balanced downward channel, and whether it can break through upward remains to be seen. From the daily chart, after the gold price broke through the 50-day SMA ($3,323.6) with a bearish engulfing pattern on Tuesday, yesterday's rebound still failed to close above this line, indicating that the 50-day SMA remains a significant resistance. In the early Asian session today, it is still struggling near the 50-day SMA. Therefore, for a re-deployment of long positions, the gold price must close above $3,346 in the future. In the short term, the top of the hourly chart's downtrend channel at around $3,330.5 is regarded as the first major resistance for the day. Before gold breaks above the previous rebound high of $3,345.9, the price remains in a downtrend. It is not advisable to chase the price too high before a significant breakthrough. It is estimated that the gold price will fluctuate between $3,280 and $3,330. It is recommended to adopt a strategy of selling at higher levels and buying at lower levels within the aforementioned range based on technical signals. The above content is for reference only and does not constitute investment advice. MTF Special Analyst Zheng Guangfu
2025-07-10
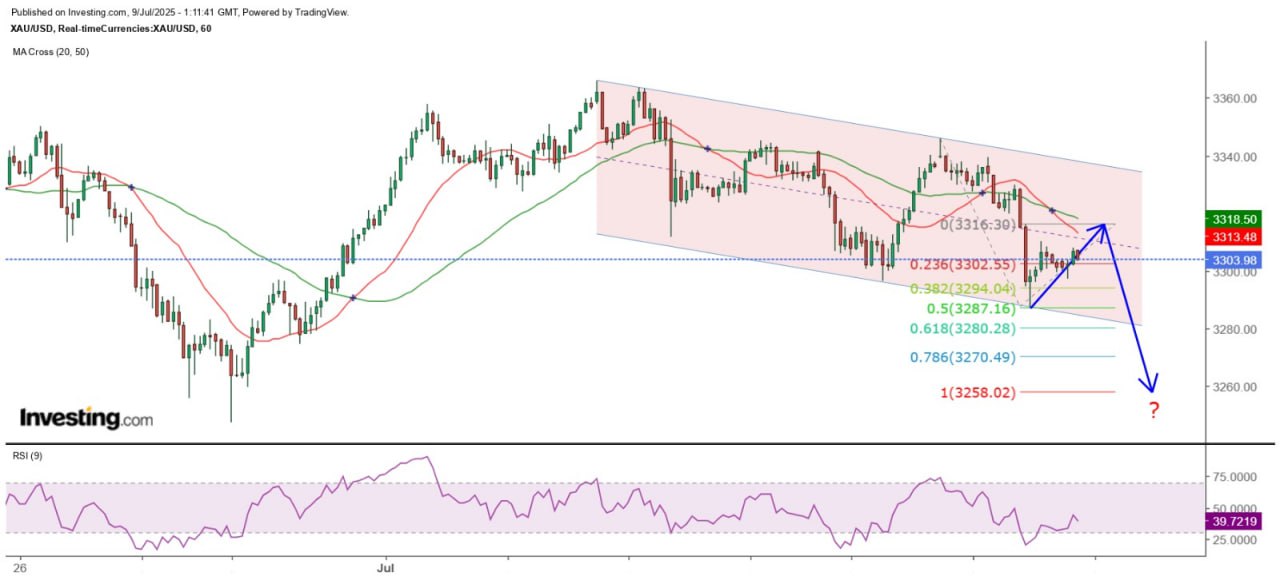
"Gold Price Short-Term Trend Shows a Descending Channel Pattern" 9/7 9:37 am Completed US President Trump announced that the final implementation date for reciprocal tariffs would be set on August 1st, and emphasized that there would be no further extension. As the original "deadline" of July 9th was pushed back, it reflects that Trump still hopes to reach trade agreements with his trading partners, or that so far, few countries have reached trade agreements with the US, forcing him to extend the negotiation period. Therefore, only Trump knows whether August 1st is truly the "deadline". Global money supply continues to reach new highs. At present, investors may be concerned that if reciprocal tariffs lead to a sharp rise in US inflation, the Federal Reserve cannot cut interest rates, which would be unfavorable for gold. But isn't gold traditionally an inflation hedge? Why is its performance so weak now? This can be attributed to both long-term and short-term factors. The long-term factor is related to the money supply. The Federal Reserve began raising interest rates in March 2022 and ended in July 2023. It started cutting interest rates in September last year and slowed down the pace of balance sheet reduction. The M2 money supply of the world's four major central banks (the United States, Europe, Japan, and China) reached a record high of nearly 93.7 trillion US dollars in May, indicating that the previous interest rate hike cycle did not reduce the balance sheet at the same pace. In the short term, the military conflict between Iran and Iraq and Trump's reciprocal tariff measures have supported the further rise of gold prices. However, the geopolitical crisis in the Middle East caused by the Iran-Iraq conflict has been rapidly resolved (although the Middle East remains a powder keg in the foreseeable future), and countries are striving to reach trade agreements with the United States. The cumulative increase in gold prices this year has reached 33% for spot gold and 22% for August gold futures. It is not just an inflation hedge but has far outpaced inflation. However, in an increasingly uncertain global political and economic situation, gold, which has no productive capacity, will naturally become a cash-out tool. The recent new highs of the S&P 500 and Nasdaq indices reflect that the negative impact of reciprocal tariffs on the global economy may not be as severe as expected. The market outlook is gloomy after the 50-day moving average was lost. In terms of the trend, the gold price rebounded to a high of $3,451.6 on June 16th and then presented a double-day reversal pattern, erasing all gains from the previous day. This was the first strong signal of a downturn in the recent period. The subsequent movement was volatile and downward, with a single-day reversal and a bearish engulfing candlestick pattern. After breaking below the 20-day SMA ($3,846.7) on June 24th, it only closed above this line on July 2nd. Recently, it has remained above the 50-day SMA for five consecutive trading days, but lost this position yesterday. Yesterday, the spot gold price closed below the 50-day SMA ($3,321.7) in a bearish engulfing pattern and briefly fell below the psychological level of $3,300. The outlook remains bearish. In the short term, the gold price has been in a downward channel since July 2nd. It is expected that $3,316 and $3,330 will be the main resistance levels in the immediate term. It is not ruled out that it will test $3,267 or even $3,258 before rebounding within the day. The above content is for reference only and does not constitute investment advice. MTF Special Analyst Zheng Guangfu
2025-07-09
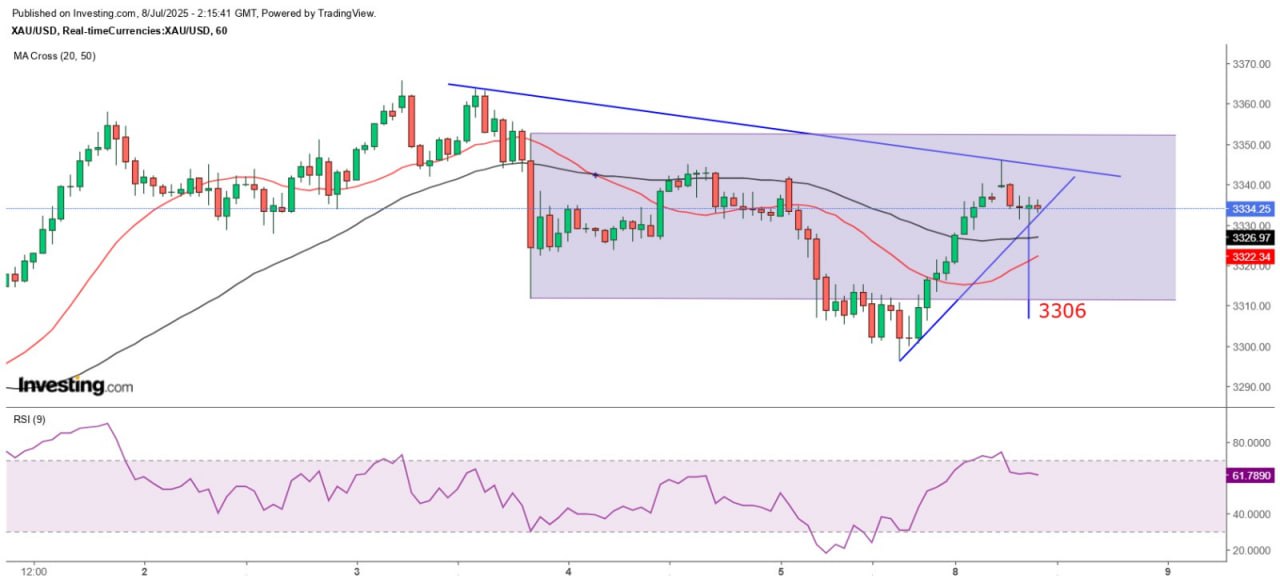
"Gold Price Maintains Sideways Pattern Awaiting Breakout" 8/7 10:12 am Finalized Last night, US President Trump announced that starting from August 1st, the United States would impose a 25% reciprocal tariff on Japan and South Korea. He also stated that if Japan or Japanese enterprises decide to build factories or manufacture products within the United States, no tariffs would be imposed. Japanese Prime Minister Shinzo Abe expressed regret over the US decision to impose tariffs on Japan and instructed that Japan would continue to negotiate with the United States on tariffs. He also said that the negotiations between the two sides in the past period had successfully avoided tariffs of 30 to 35%. In addition, tomorrow is the deadline for the suspension of reciprocal tariffs. Although countries are eager to reach an agreement with the United States, the overall uncertainty of trade negotiations remains high. Over the past few months, central banks around the world have continuously increased their gold holdings, which is one of the reasons for the rise in gold prices. The People's Bank of China also increased its gold reserves by 70,000 ounces in June, marking the eighth consecutive month of increase. However, the holdings of SPDR Gold ETF have remained unchanged in the past two trading days. It is estimated that investors are waiting to see what kind of trade agreement will be reached between countries and the United States before the deadline, and therefore are temporarily holding back. Short-term trapped between the 20-day and 50-day moving averages The news that the US imposed tariffs on Japan and South Korea led to a sharp drop in the US stock market. Spot gold prices rebounded continuously after hitting a low of $3,296.5 in the European midday session yesterday. The related news further pushed up the gold price, which reached a high of $3,335.9 in the early Asian session today. The significant rebound in gold prices yesterday enabled it to close above the 50-day SMA ($3,322) for five consecutive trading days, but it still failed to break through the 20-day SMA ($3,350.7), remaining trapped between the two moving averages and waiting for a breakout. As the gold price closed in a piercing pattern on July 3rd, it is expected to fluctuate between $3,312 and $3,365 before breaking above the top of that day at $3,365.8. In the short term, if the gold price breaks below the ascending trend line on the hourly chart, the measured decline target is approximately $3,306, and $3,346 is expected to be the main resistance level for the immediate period. As there are no significant data releases from the US today, the gold price is likely to continue in a range-bound pattern, but tariff-related news will make its performance more volatile. The above content is for reference only and does not constitute investment advice. MTF Special Analyst Zheng Guangfu
2025-07-08
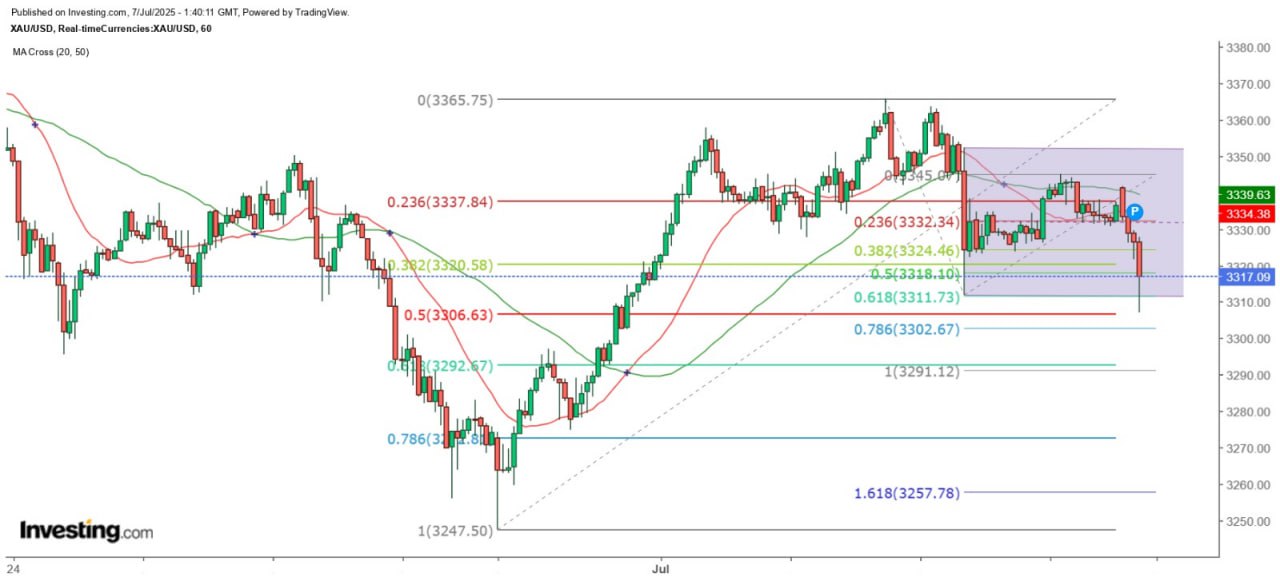
"Gold prices are expected to remain range-bound in the short term" 7/7 9:50 am Finalized The U.S. June non-farm payroll report was better than expected, which cooled market expectations for the Federal Reserve to cut interest rates this month. As a result, gold prices dropped by 1% last Thursday. Last Friday was the U.S. Independence Day, and the gold market closed early. Gold prices closed slightly higher. August gold futures rose 0.11% to $3,346.5 per ounce. Spot gold closed at $3,336.7, up 0.1%. US President Trump signed the "Big and Beautiful Bill" into law last Friday. The nonpartisan Congressional Budget Office (CBO) expects the bill to increase the US federal deficit by $3.3 trillion over the next 10 years and cause nearly 12 million people to lose their health insurance. Reciprocal tariffs and fiscal concerns have put pressure on the US dollar exchange rate, which may boost the safe-haven demand for precious metals. The outcome of trade negotiations influences the gold price. July 9th will be the deadline for the suspension of reciprocal tariffs. The US and China have reached a framework agreement, while the US and the UK and the US and Vietnam have reached agreements. Negotiations between the US and the EU are still ongoing. The Trump administration said that it began sending letters to various countries last Friday to determine the tariff rates they will face when importing to the US. As there are no important economic data releases in the US this week, gold prices are expected to remain in a range-bound pattern. The outcome of the negotiations between the US and its trading partners before the deadline is believed to be the only excuse for gold prices to break out of the sideways market. In terms of the trend, since June 24th, the 20-day and 50-day SMA of the spot gold price have been in a balanced sideways development. Currently, the gold price is fluctuating between the two lines (3349.7 to 3321.8). Investors should note that the spot gold price on the daily chart presented a bearish engulfing pattern last Thursday, indicating that the high of $3365.8 on that day may become a major resistance for the medium-term rebound. Moreover, although the SPDR Gold ETF holdings increased significantly by 7.16 tons to 957.4 tons on June 24th, they dropped to 947.66 tons on July 3rd, reflecting that large investors still tend to reduce their holdings at higher prices. The 50-day moving average may become a medium-term resistance. Gold prices opened slightly higher in the Asian market this morning but then plunged sharply, breaking through the low point seen after the release of the non-farm payroll report last Thursday. After briefly testing the $3,307 level, it rebounded. It was just short of the 50% retracement level of the biggest pullback from June 29 to July 2 at $3,306.63. I think this is due to the approaching expiration of the tariff truce. Judging from the current situation, import inflation in the US and its trading partners will not rise significantly as a result. Gold has lost its role as an inflation hedge, and the current price is only about $200 away from its historical low. Long positions should take profits at higher levels. Optimistically speaking, the spot gold price will fluctuate between $3,312 and $3,352 today. However, it cannot be ruled out that it will test the $3,291 level (the 100% Fibonacci extension of the decline on the hourly chart). At that time, $3,312 is expected to be a resistance level for the rebound, and the 50-day SMA will be a medium-term resistance. The above content is for reference only and does not constitute investment advice. MTF Special Analyst Zheng Guangfu
2025-07-07
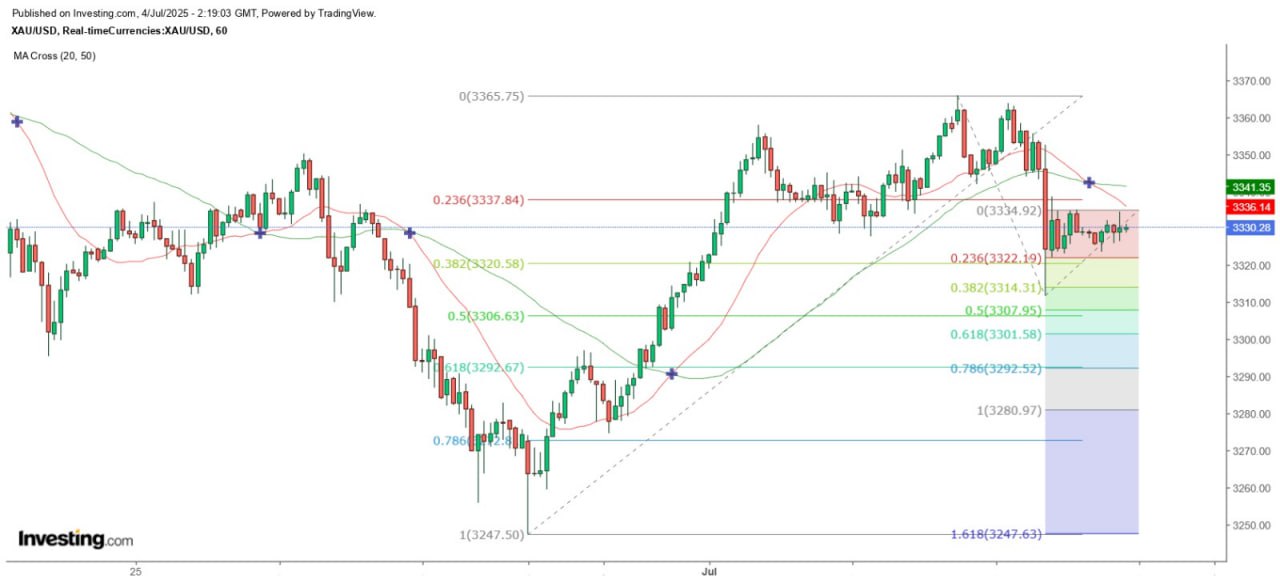
"Gold Price Short-Term Trend Sideways Weak" 4/7 10:32 am Completed The U.S. June non-farm payroll report was released. The overall number of jobs increased by 147,000, but the number of new government jobs accounted for 73,000, while the number of new private sector jobs was 74,000. The average hourly wage rose to $36.30, and the unemployment rate dropped by 0.1 percentage point to 4.1%. The overall labor force decreased by 130,000, the number of unemployed people also decreased by 222,000, while the number of people who left the labor market increased by 329,000. After the data was released, the interest rate futures market expected that the probability of the Federal Reserve maintaining the federal funds rate at 4.25% to 4.5% in July rose sharply to 93.3%. The US dollar exchange rate rose across the board. The euro fell to 1.1718 against the US dollar; the pound sterling dropped to 1.3586 against the US dollar; and the US dollar rose sharply to 145.23 against the Japanese yen. The gold price also plunged, with the spot gold price once falling to $331.18 per ounce. Will the Federal Reserve definitely not cut interest rates in July? However, does the June non-farm payroll report indicate that the US job market is completely problem-free? The answer is no. The increase in public sector jobs accounted for almost half of all new jobs. If we exclude the changes in public sector employment, starting from January 2021 after the pandemic, the average monthly non-farm payroll increase in the private sector has been steadily decreasing by approximately 100,000 positions each year. In 2021, it was 479,667; in 2022, 378,833; in 2023, 207,667; in 2024, 162,250; and in the first half of this year, it averaged 120,667, still maintaining an increase of over 100,000. Nevertheless, the trend shows that job growth in the US private sector is clearly slowing down. Whether the Federal Reserve will not cut interest rates in July depends first on what kind of trade agreements the US reaches with its trading partners after July 9th, and secondly on whether the series of price data for June reflect a further slowdown in inflation. The price of silver is expected to break through its peak. After a sharp drop yesterday, spot gold prices stabilized above $3,322. However, attempts to break through $3,335 were unsuccessful. This morning in the early Asian session, the highest price reached was only $3,334.4. From the hourly chart, it is clear that $3,352.45 is the short-term maximum resistance for the rebound. With the expectation of no interest rate cut by the Federal Reserve in July, gold prices are likely to fluctuate between $3,320 and $3,344 in the short term. If it breaks below $3,311.8, it is expected to test $3,306 and $3,292. Relatively speaking, the price of silver closed with a bullish candle yesterday, seemingly confirming the view that the gold-silver ratio was too high and is now undergoing correction. From the daily chart, the support at $35 is strong for the silver price, and it shows a small round bottom pattern. The market is likely to break through the high of $37.335 on June 18th in the future. In the short term, $36.34 is an important support level for any adjustment. The above content is for reference only and does not constitute investment advice. MTF Special Analyst Zheng Guangfu
2025-07-04
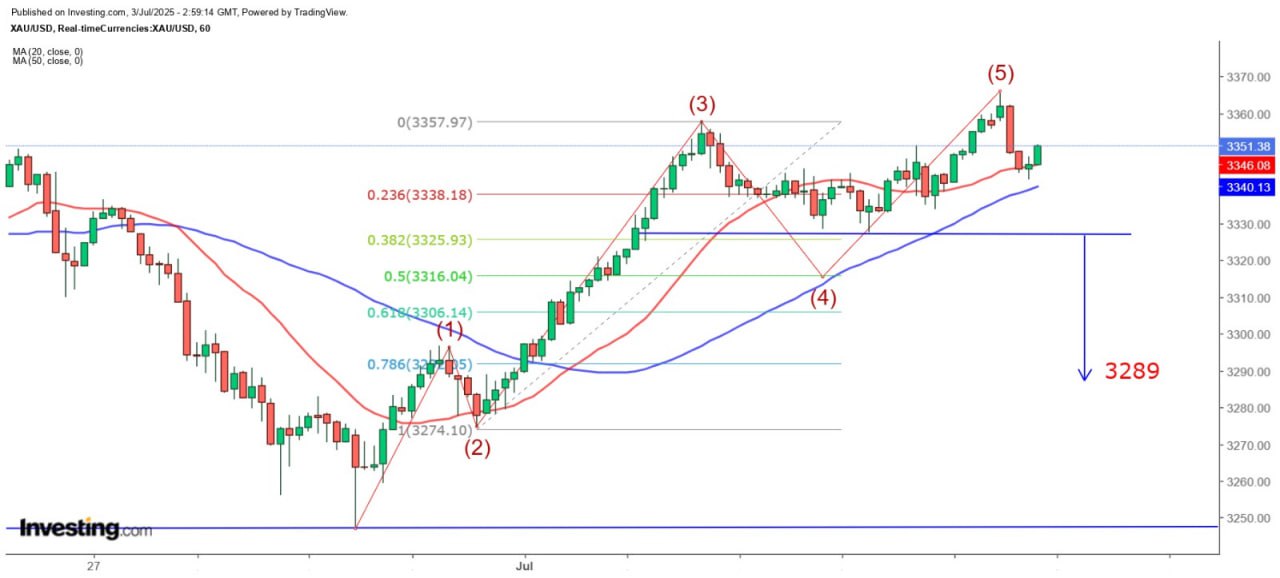
"Gold Prices May Soon Enter a Correction Phase - Be Cautious" 3/7 11:00 am Completed The June private-sector employment change data released by the US private institution ADP yesterday is believed to have surprised investors. Employment positions decreased by 33,000, far worse than the market expectation of an increase of 99,000. It was the first decrease since February 2021 (78,000 in January 2021), and the number of new positions added in May was revised down from 37,000 to 29,000. Nela Richardson, chief economist at ADP, said that although layoffs remain rare, the decrease in June was due to companies' reluctance to hire new employees or replace those who left. However, the slowdown in hiring has not yet affected salary growth. Tariffs affect enterprises' recruitment activities. In my opinion, the reluctance of enterprises to hire or fill positions in June is related to the expiration of the suspension of reciprocal tariffs on July 9th. However, as of now, the United States has reached a trade framework agreement with China, and has recently reached an agreement with Vietnam. India is next, and the European Union is also striving to reach an agreement with the United States before the deadline. Subsequently, ten countries will succeed, while Japan's situation remains uncertain. Therefore, investors should consider that even if the non-farm payroll report for June is poor, there may be a significant turnaround in July. Moreover, the ADP's non-farm employment change data does not always closely match the official figures and sometimes even shows a negative correlation. Therefore, it is not advisable to treat the two sets of data as equivalent. As this Friday marks the Independence Day of the United States, the US Department of Labor will release the June non-farm payroll report today ahead of schedule. Currently, the market expects an increase of 120,000 non-farm jobs and the unemployment rate to rise from 4.2% to 4.3%. The ADP employment data has raised concerns among investors that the official employment figures will also be poor, thereby increasing the probability of the Federal Reserve cutting interest rates in July and causing the US dollar exchange rate to fall after the release of the ADP data. Don't be overly optimistic before the 20-day moving average is held steady. Spot gold prices fluctuated after the release of the data, surging by more than $11, then sharply falling back to $3,343 before rising again. However, after reaching a high of $3,351, it repeatedly declined and even fell below the pre-data release low, touching $3,334 before climbing again. After the London market closed, it briefly rose above the $3,350 level and in the early Asian market, it rose to $3,365, but then sharply dropped and returned below $3,350. From the hourly chart, the pullback of gold prices from the high of $3,357.97 is extremely close to the 38.2% retracement of wave 3. After breaking through the top of wave 3 this morning, it quickly fell back, which likely indicates the completion of wave 5, followed by an abc corrective wave. A break below the top of wave 1 at $3,296.52 would signal the start of a higher-level wave 3. From the double top formation, $3,327.73 is the neckline. Once this level is breached, the measured decline target is $3,289.71. Gold prices are currently in a stalemate at the 20-day SMA ($3,349.15). Before it clearly closes above this line, it is not advisable to be overly optimistic. Investors can use a smaller time frame, such as the 5-minute chart, and operate based on technical signals to avoid falling into the trap of subjective wishes. The above content is for reference only and does not constitute investment advice. MTFSpecial Analyst Zheng Guangfu
2025-07-03
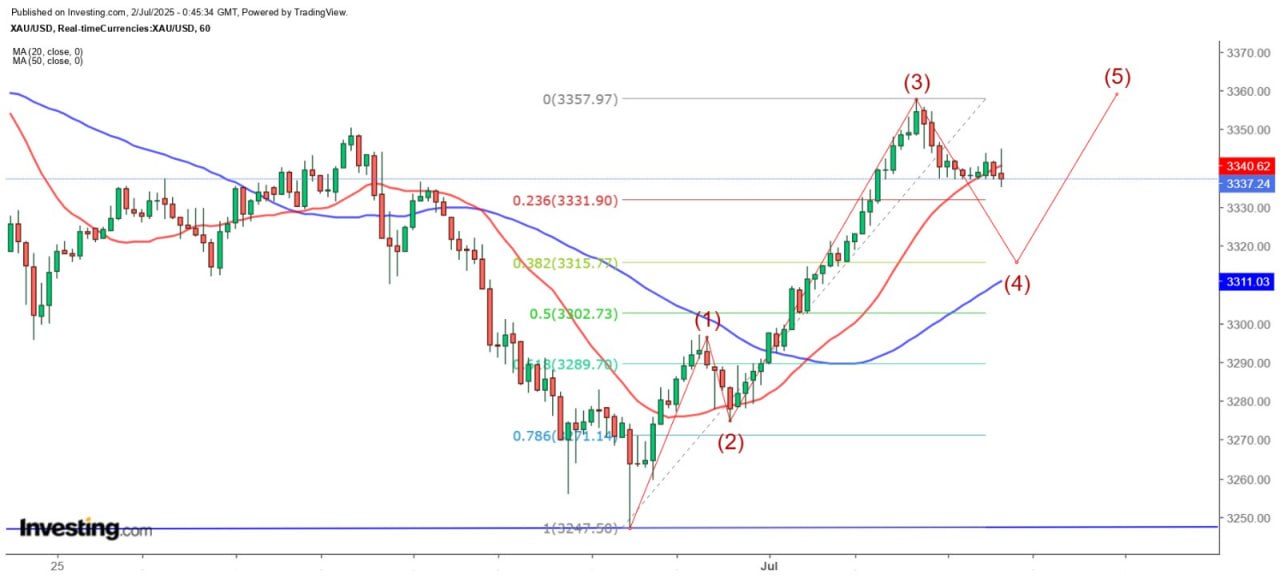
"Gold Price Short-Term Trend Expected to Fall First Then Rise" 2/7 10:00 am Completed Gold prices staged a so-called retaliatory rebound on the first trading day of the second half of the year. Spot gold prices approached $3,358 per ounce in the early New York market yesterday, rising above the 50-day SMA (3,320.8) and even breaking through the 20-day SMA (3,351.4). It is a common practice in financial markets to "match events or economic data to price movements", that is, to try to explain the reasons behind price rises and falls. This is not surprising, as financial markets are filled with known and unknown information for investors, and investors dislike uncertainty the most. If they know the reasons behind price movements, they may feel more at ease. I, on the other hand, would observe the reasoning held by the market to further grasp the direction of price movements. Tariff measures have hindered interest rate cuts. Based on the current evidence, the possibility still exists that the Federal Reserve may cut interest rates as early as July. When asked yesterday at the European Central Bank forum whether a rate cut in July would be too early, Fed Chair Powell said that this possibility could not be ruled out. The authorities will make a decision at each meeting rather than ruling out a rate cut in advance, and everything depends on the performance of economic data. However, he reiterated that if it were not for Trump's high tariffs, the authorities might have cut rates further. Although the gold price has temporarily returned above the 50-day SMA and even broke through the resistance of the downtrend channel on the daily chart yesterday, the significant rise on Monday makes a false breakout more likely yesterday. The cumulative rebound of the spot gold price since the beginning of this week has exceeded 50% of the maximum decline from June 16 to 30. If the rebound reaches 61.8%, the gold price could reach $3,373.4. $3,400 remains a key resistance level, and the short-term probability of a price pullback is relatively high. Gold prices may fall back after forming a double top at 3358. In the short term, since gold prices have re-stabilized above $3,300, this level is expected to once again serve as a key support for immediate adjustments. Gold prices are likely to fluctuate above this level in the short term. If gold prices challenge this level again within the day, be cautious of a double top and subsequent decline. From an hourly chart perspective, gold prices have reached the basic upward range of the third wave and are now in the fourth wave of adjustment. The downward target is $3,315, and a deeper adjustment could reach $3,302.7. $3,358 can be temporarily regarded as the upward target of the fifth wave. However, even if this level is broken, a double top and subsequent decline is highly possible. Therefore, it is expected that gold prices will show a pattern of first decline and then rise in the short term. The above content is for reference only and does not constitute investment advice. MTF Special Analyst Zheng Guangfu
2025-07-01
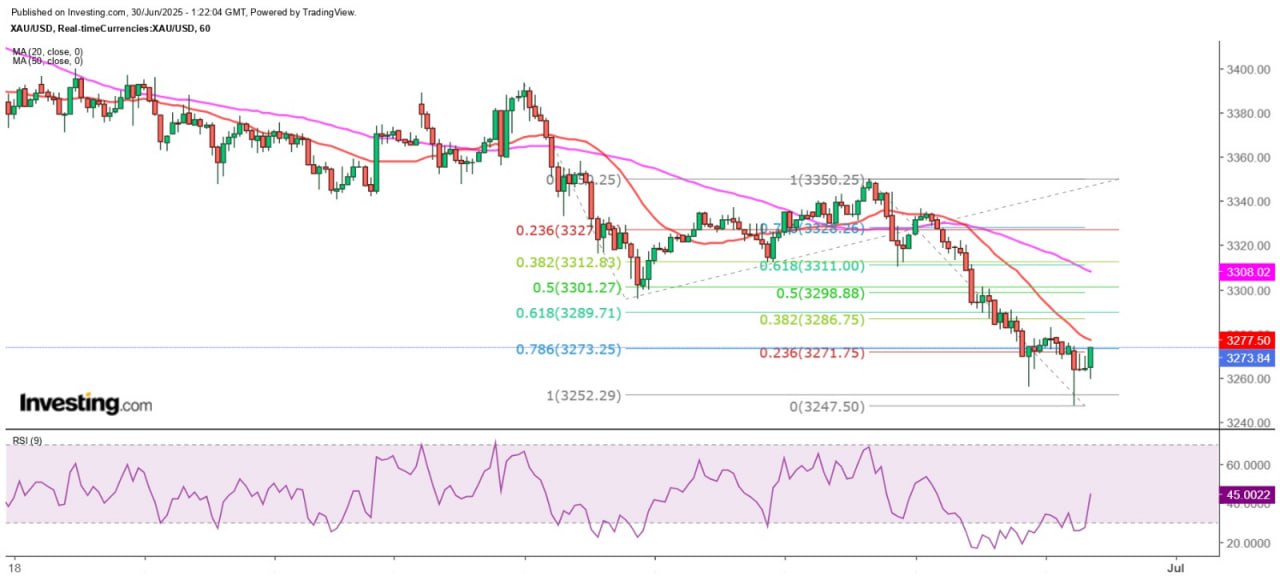
"Gold Price: Be Cautious in Short-Term Bets for a Short-Term Rebound" 30/6 9:18 am Completed Gold prices plunged to a near one-month low last Friday as investors shifted to high-risk assets amid easing geopolitical tensions in the Middle East. July gold futures dropped 1.8% to close at $3,273.7 per ounce, with a weekly decline of about 2.9%. July silver futures fell 1.5% to close at $36.04 per ounce, while spot gold settled at around $3,274 per ounce. The US-China trade talks have reached a framework agreement. The United States and China have made progress in trade negotiations. China has agreed to provide the United States with the much-needed rare earths. White House officials said that the United States and China have reached "additional understanding on the framework for implementing the Geneva agreement", and a spokesperson for China's Ministry of Commerce later said that both sides have "confirmed the details of the framework", and pointed out that the United States will lift "restrictive measures", while China will "review and approve" export control projects. In addition, US Commerce Secretary Wilbur Ross said that negotiations with ten other countries are ongoing, reflecting a shift from the previous rigid stance on trade policy. This news encouraged investors, triggering a rebound in the US stock market and causing gold prices to fall. In terms of data, consumer spending, which accounts for over 60% of the US GDP, slightly declined by 0.1% in May, indicating the impact of tariffs on consumer demand. Personal income also decreased by 0.4% in the same month. Moreover, the overall US PCE rose by 0.1% month-on-month in May, in line with the increase in April and market expectations. The year-on-year increase in PCE accelerated to 2.3%, higher than 2.2% in April, in line with expectations. The year-on-year increase in core PCE also accelerated to 2.7%, higher than the revised 2.6% in April. Gold prices have broken below the 50-day moving average, indicating a medium-term weakening trend. Gold prices were under pressure across the board last week, hitting a low of $3,255 on Friday before rebounding and then falling again, unable to regain the $3,300 mark. This morning in the early Asian session, it briefly touched $3,247.5 before stabilizing above $3,260. The cumulative decline has met the 100% Fibonacci extension target of $3,252 that I mentioned on the hourly chart. However, it's important to note that spot gold closed below the 50-day SMA ($3,323.8) for the first time since January 8th, and also broke through the TD demand line on the daily chart, with a measured decline target of $3,129, close to the adjustment low of $3,120 on May 15th. Therefore, this level is expected to be the next major support level for spot gold. As the gold price has reached the Fibonacci extension level of the decline, the short-term rebound opportunity is relatively high. However, it is expected that the 50-day SMA will act as a resistance for the rebound. Additionally, there are four technical resistances between $3300 and $3315: 1) 50% retracement of the short-term decline on the hourly chart - $3298; 2) 50-hour SMA - $3308 (continuously declining over time); 3) previous double bottom support on the hourly chart - $3312 to $3310; 4) 61.8% retracement of the short-term decline on the hourly chart - $3311. Therefore, the $3300 to $3315 range is a strong resistance zone for the gold price in the short term. Even if investors are optimistic about the short-term trend of the gold price, they should wait for it to close above $3275 on the hourly chart before considering a rebound. The above content is for reference only and does not constitute investment advice. MTF Special Analyst Zheng Guangfu
2025-06-30
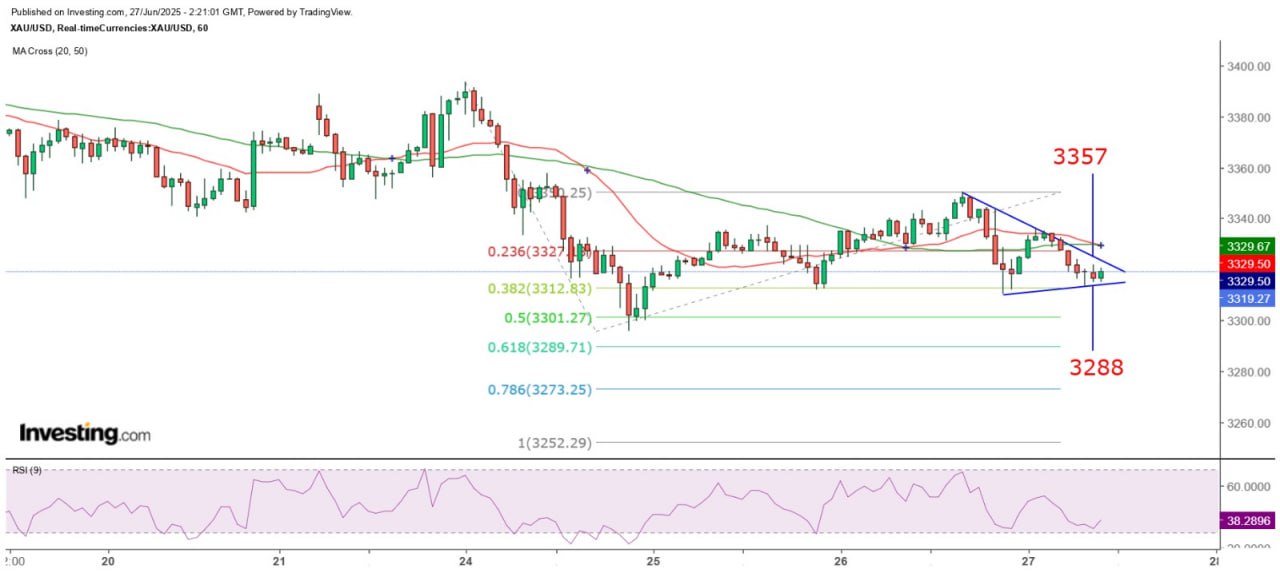
"Gold Price Falls Below 50-Day Moving Average, Trend Remains Weak" 27/6 10:19 am Finalized Yesterday, the US Department of Commerce released the final value of the first-quarter GDP. After annualization, it contracted by 0.5% quarter-on-quarter, a larger decline than the expected 0.2%. The biggest drag on GDP was foreign trade, which reduced GDP by 4.61 percentage points. The largest contributor to GDP was private investment, which increased GDP by 3.9 percentage points. Government spending slightly reduced GDP by 0.1 percentage points, and personal consumption only increased GDP by 0.31 percentage points. It is obvious that this was caused by Trump's preparation to implement reciprocal tariffs. US durable goods orders post biggest increase in over a decade However, US durable goods orders rose by 16.4% month-on-month in May, the largest increase since July 2014. Orders for transportation equipment rose by 48.3%, while orders for capital goods increased by 48%. Non-defense and defense orders rose by 49.4% and 38.7% respectively. Excluding defense orders, orders rose by 15.5% month-on-month. New orders excluding transportation items rose by 0.5% month-on-month. A key indicator reflecting business spending, orders excluding defense and aircraft, rose by 1.7% month-on-month, far exceeding expectations of 0.1%. Yesterday, spot gold prices rose repeatedly after the opening of the European market, reaching a high of $3,350. After that, they fluctuated and fell back. After the release of the US data, spot gold prices dropped sharply from the $3,344 level, hitting a low of $3,310 before gradually recovering. However, they were blocked at the $3,333 level. From the hourly chart, it can be seen that gold prices fell below the low point of Wednesday this week, breaking the pattern of each wave being higher than the previous one since June 24. Eventually, they closed below the 50-day SMA ($3,324.5), the first time since January 8 this year to close below this line, sending a medium-term bearish signal. Gold prices may break through $3,300 again. If gold fails to return above this line today with a strong two-day reversal pattern, it is likely to test lower levels further. Currently, the hourly chart shows a narrowing triangle formation. The first short-term target for a decline is $3,288. If it breaks above the downtrend line, the first resistance is at the overlap of the 20-day and 50-day SMAs at $3,329. Further upward, the main resistance is at $3,357, while $3,371 remains a key resistance in the medium term. Yesterday, gold rose to a high of $3,350.25, so the Fibonacci 100% extension level mentioned yesterday becomes $3,252.29. Silver performed relatively strongly. On the contrary, silver has performed relatively strongly. The silver price has remained above the 20-day SMA (36.16). From the hourly chart, it can be seen that there is strong support at $36.24, and another strong support level is at $36.36. Unless the silver price closes below this level on the hourly chart, it is expected to challenge yesterday's high of $36.83. The above content is for reference only and does not constitute investment advice. Mingde Special Analyst Zheng Guangfu
2025-06-27
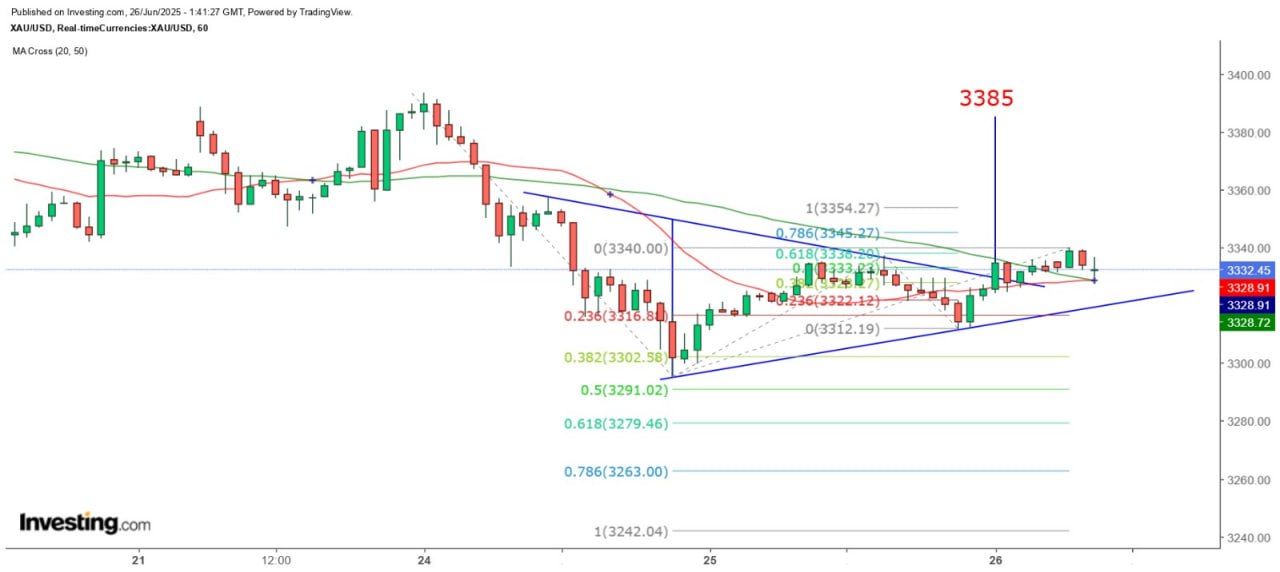
"Gold Price Rises Slowly, Beware of Descending Flag Pattern" 26/6 9:52 am Completed Federal Reserve Chair Powell attended the second day of the House Financial Services Committee hearing. Regarding monetary policy, Powell said that if stagflation occurs, it will put the authorities in a difficult position, although this is not the basic expectation, the Federal Reserve will closely monitor it. He also said that the uncertainty of tariffs reached a peak in April, and inflation expectations have declined compared to April this year. In addition, he said that fiscal policy may push up inflation, while monetary policy does not consider debt issues, and that the changes in the authorities' predictions partly reflect the impact of trade policies. He also said that a reasonable expectation for tariffs is that they will bring a certain degree of inflationary pressure. The US economy is still growing at present, the labor market is stable, and inflation is at a relatively good level. The current interest rate is slightly tight. My understanding is that he believes tariffs put upward pressure on inflation, but not as much as previously expected. A slightly tight interest rate has a certain inhibitory effect on the inflation rate (is there room for adjustment?). The Federal Reserve may cut interest rates in July, but it still depends on the performance of recent data. SPDR has reduced its gold holdings for the second consecutive day. Tonight, the US will release a series of economic data. The most watched is the May durable goods orders, which are expected to increase by 8.6% month-on-month; and the May goods trade balance, which is expected to show a $86.3 billion deficit. The final GDP figure for the first quarter will also be released tonight, with expectations remaining at a 0.2% quarter-on-quarter contraction after annualization. The first-quarter PCE will also be released, with expectations for core PCE to rise by 3.4% quarter-on-quarter. However, as both the GDP and PCE data are quarterly, their impact on the market is relatively low. Regarding gold prices, SPDR Gold ETF reduced its holdings by 2.29 tons yesterday, bringing the total holdings down to 953.39 tons. Gold prices have maintained a rebound trend, with spot gold reaching a high of $3,340 in the early Tokyo market today before slightly retreating. Currently, the expected development of gold prices is diverse (technical pattern). From the hourly chart, if it reaches the 100% Fibonacci extension level, the gold price could reach $3,354; if it breaks through the descending trend line of the triangle, the measured upward target is $3,385, which would break through the top of the large bearish candle on June 24th at $3,371, forming a breakout signal and leading to a strengthening of gold prices. $3,354 could be a key turning point. However, investors should be cautious that gold prices may be forming a descending flag pattern. If it continues to rise slowly and is clearly blocked and falls back at $3,354, the possibility of this pattern increases. On the other hand, if the gold price breaks through $3,312, the upward trend of each wave being higher than the previous one since June 24th will be broken. Additionally, if the decline from the peak of $3,393.55 on June 24th reaches the 100% Fibonacci extension level, based on the current morning high of $3,340, the target for the decline would be $3,242. The above content is for reference only and does not constitute investment advice. MTF Special Analyst Zheng Guangfu
2025-06-23
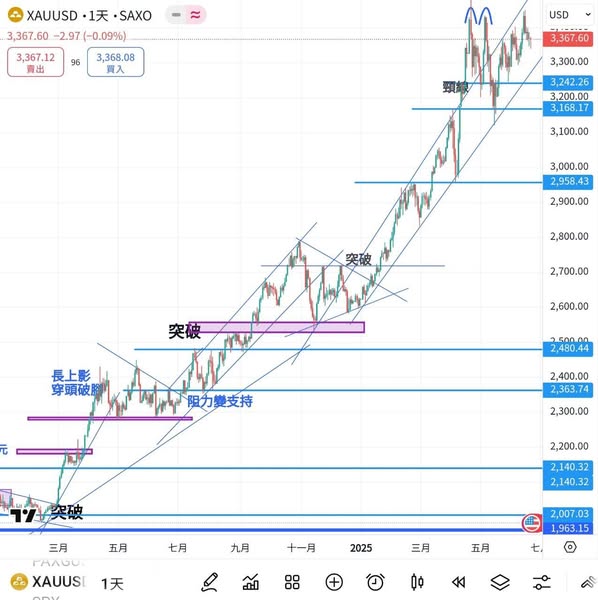
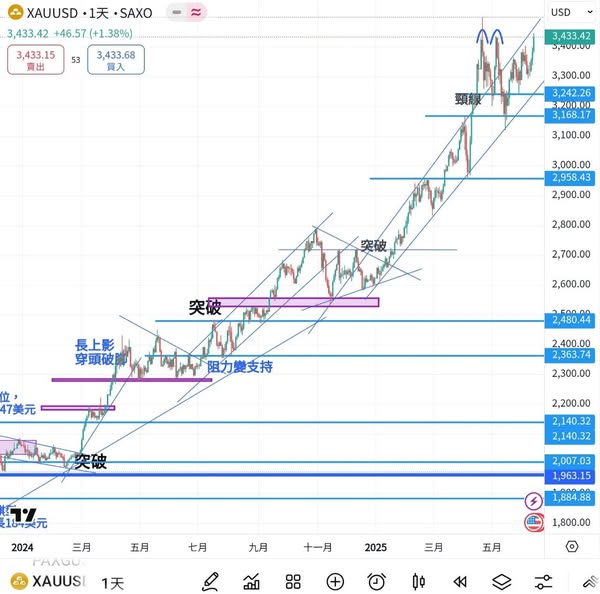
Last week, under the conflict between Israel and Iran, the gold price still faced pressure at the high level and failed to break through the new high. On Monday, gold prices opened higher. After Israel's air strike on Iran, although Iran was in a weak position, it was not willing to accept the attack. Over the weekend, it counterattacked Israel with missiles and drones. After testing the 3451 position, gold prices began to show pressure. Gold prices were constrained by technical resistance at the top. Moreover, although the United States verbally supported Israel, it did not take any substantive actions. Iran also did not further attack military camps in Europe and the United States, and the battle line did not extend further. The market basically digested the news of the war last week, laying the groundwork for gold prices to fall back. During the midweek, the Federal Reserve held an interest rate decision. The market has highly expected the United States to maintain its interest rate unchanged, but investors are paying attention to the implications of the dot plot for future interest rates. The US has kept its interest rate unchanged at 4.50% as expected. The latest dot plot indicates that it will cut interest rates twice by the end of the year, each by 0.25%, and will also cut interest rates by 0.25% again in 2026 and 2027. Interest rates have remained higher than the market's original expectations for the long term, and as a result, gold prices have been restrained and declined. The market did not see more tariff news to blow, but the high interest rate was unfavorable for the gold price. The gold price developed weakly throughout the week and failed to rise above 3,400, but the space for a significant pullback from the low level was also limited. This week, the United States will release the PCE inflation data. There is a slight risk of contraction in the US labor market, but the Federal Reserve's intention to cut interest rates still needs to be closely watched. The trade war will eventually lead to an increase in the price level. If the PCE index rises this week, it may increase the Federal Reserve's determination to maintain high interest rates. On the contrary, if inflation is not high, it increases the bargaining chips for the Federal Reserve to cut interest rates. Technically, the gold market still tends to consolidate at a high level and is more suitable for short-term trading. Let's take a look at the market situation. You might as well refer to each other.
2025-06-16
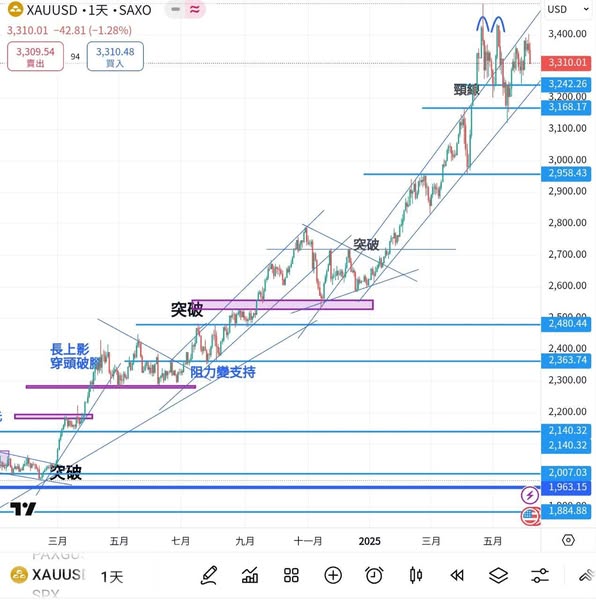
Last week, the gold price rose steadily. Israel launched an air strike on Iran, and Iran threatened to retaliate, saying that the world would see why Iran needed to develop nuclear weapons technology. The geopolitical risk was extremely high, which stimulated funds to flow into the gold market for safety. The gold price rose nearly 150 US dollars from high to low throughout the week and hit a two-month high, moving towards the historical high of 3,500. At the beginning of the week, the trade dispute between China and the United States seemed to have a turn for the better. Although the US earlier claimed that China had violated the previous Geneva trade agreement, the opportunity for the heads of the US and China to hold talks still alluded to market concerns, causing the gold price to struggle around 3,300 and lacking the ability to break through upward significantly. The US released the CPI data in the middle of the week, which was lower than expected. Whether the inflationary pressure is significant or not, the Federal Reserve has more room to cut interest rates, which supports the development of gold prices. Gold prices have begun to challenge the two-week high. On the other hand, geopolitical risks have sharply increased. The United States has asked its ambassadors and nationals in the Middle East to withdraw, and the situation in the Middle East has become tense. Although there have been new developments in the China-Us negotiations, with the United States obtaining rare earths and China's tariffs being determined, the decline in gold prices has not been significant. On Friday morning, Israel launched an air strike against Iran. Iran threatened to fight back, causing extreme panic in the market. Funds flowed into the gold market for safety. After breaking through the 3,400 mark, the gold price rose steadily, reaching a weekly high of 3,446. Later, it retreated and held steady above the 3,400 mark. On the daily chart, it closed above 3,400 for the first time. Looking ahead to this week, the escalating geopolitical situation will still provide support for gold prices. In the middle of the week, the Federal Reserve will hold an interest rate meeting. It is expected that the interest rate will remain unchanged, but the statement after the meeting will offer some insights into the direction of interest rates in the second half of the year, which requires close attention. Let's take a look at the market situation. You might as well refer to each other.
2025-06-09
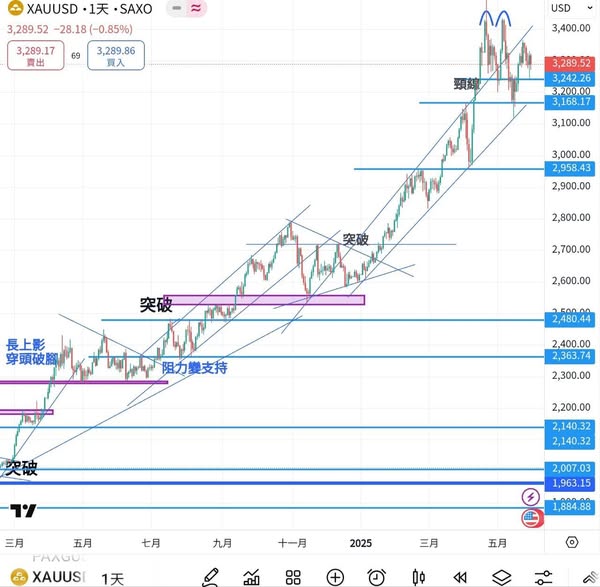
Last week, the four major precious metals - gold, silver, palladium and platinum - took turns to exert their strength. Under the global de-dollarization policy, the precious metals market has soared. At the beginning of the week, as Trump accused China of violating the Geneva Agreement over the previous weekend, the market was worried that there would be new measures in the trade war. Market funds were pushed into the gold market for safety. By the opening on Monday, the gold price had been rising steadily. Compared with the closing price of the previous week, the gold price had soared by 100 US dollars and only took a break before the 3,400 mark. Although there are some violations in the trade agreement between China and the United States, no details have been seen yet. Coupled with the lack of a new round of countermeasures, the market has begun to respond coldly. Recently, the Internet has made fun of TRUMP's TACO, meaning Trump ALWAYS CHICKENS OUT, that is, during the trade war, Trump often goes back on his word and sanctions are all talk and no action. As a result, gold prices have little momentum to break through their highs. When the market also reported that China and the United States would hold talks, gold prices have moderately pulled back from their high of 3,400. The ADP data in the middle of the week was very disappointing, which gave gold prices the momentum to challenge the 3,400 mark again. Unfortunately, it failed to stabilize. Seeing that gold prices failed to break through the 3,400 mark several times, the market began to shift to other precious metals. Platinum, palladium and silver were all in high demand. Among them, silver rose to a 12-year high, breaking through $36. On Thursday, it rose by nearly 4% in a single day. Palladium and platinum both reached recent highs. The continuous de-dollarization of the market has provided impetus for precious metals. On Friday night, the non-farm payroll data released by the United States was better than expected, and the labor market did not deteriorate. The Federal Reserve could be more patient in maintaining high interest rates, which put pressure on the gold price to pull back. The gold price rose only slightly throughout the week. Looking ahead to this week, the United States is about to release inflation data. Recently, due to the grace period of the trade war, there seems to be no sharp increase in the price level, but imports have plummeted sharply, which will eventually push up inflation. If inflation deteriorates, the Federal Reserve will be more willing to maintain high interest rates, which is not good for gold prices. However, the global de-dollarization support for the positive trend of gold remains unchanged. Whenever there is a pullback, it is also a good opportunity to enter the market. Gold prices at 3,400 are under short-term pressure, and the market situation is more likely to start consolidating and fluctuating. Let's take a look at the market situation. You might as well refer to each other.
2025-06-02
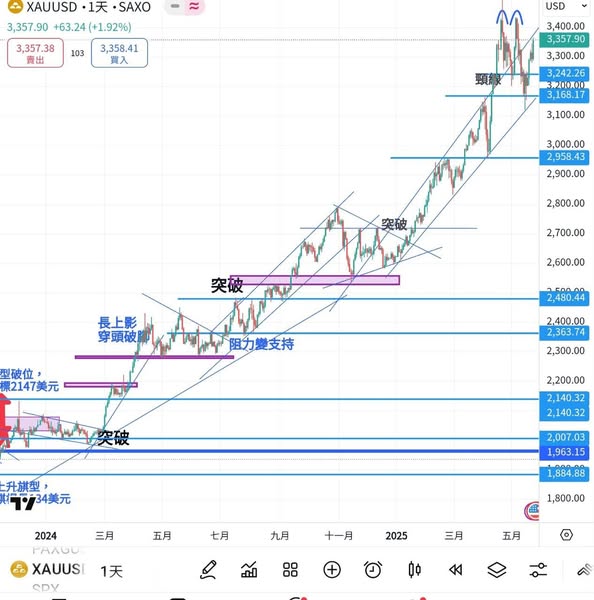
At the beginning of the week, it was Memorial Day in the United States. Market trading was relatively quiet, but news about tariffs still kept coming. The Trump administration highly announced the imposition of EU tariffs two weeks ago, but at the beginning of the week, it extended the deadline again. The exemption period immediately eased the market's risk aversion sentiment. However, due to the Monday holiday, the market did not show a reaction until Tuesday. The gold price dropped below the 3,300 level from the week's high, losing the starting point of the upward trend after the announcement of the EU tariffs two weeks ago. In the middle of the week, the Federal Reserve released the minutes of its last interest rate meeting. Many governors expressed concerns about the return of inflation. The market interpreted that the United States would maintain high interest rates for a longer period of time. Gold prices dropped in response in the early morning. What was even worse was that a district court in the United States ruled that Trump's tariff policy exceeded its authority and was invalid. Gold prices were further weakened, plummeting to a weekly low of $3,245. The PCE inflation data on Friday was moderate and did not bring much change to interest rate expectations. Gold prices consolidated and fluctuated, hovering around 3,300. Looking ahead to this week, the Trump administration will say over the weekend that China has violated trade agreements and will no longer be a good person. The Sino-US dispute will continue to stir up market sentiment, and funds are more likely to flow into gold for safety. Labor data will be available on Friday. The US labor market has not yet shown any signs of weakening. If the non-farm payroll can maintain growth above 200,000, the Federal Reserve tends to focus on inflation risks, and there will be less room for interest rate cuts. On the contrary, if the labor market weakens, the space for interest rate cuts at the end of the year may increase to three times, and gold will be able to regain new impetus and improve. Let's take a look at the market situation. You might as well refer to each other.
2025-05-26
If we look at the weekly chart, gold has reached a new high and closed above 3,350 for the first time. Benefiting from the weakness of the US dollar and the fact that gold prices have fluctuated for four weeks, there has been support from bargain hunters. As Trump threatened to impose additional tariffs on the EU over the weekend, gold prices rose sharply by 60 dollars and closed near the weekly high. Last week, the United States released few economic data. The market was more concerned about geopolitical risks. The situation between Israel and Palestine and the Russia-Ukraine peace talks did not bring much improvement. Gold prices held steady at 3200 and then started to rise. After climbing nearly 100 dollars, they hovered around 3300. The range began to expand again. However, the biggest breakthrough occurred on Friday. Trump proposed to increase tariffs on the EU to 50%. Market risks rose. Trump's tariff policy once again came to the fore. Trade imbalances and tariff policies had previously led to a "triple kill" of the US dollar, US stocks, and US bonds. Risk sentiment was reignited, driving funds to flow into the precious metals market for safety. Gold prices broke through the weekly high of 3345 and remained stable. They rose to a maximum of 3365 dollars and closed near the high, closing with a strong bullish candle. Looking ahead to this week, gold prices have broken through the neckline of the double top and rebounded, regaining strength. It is expected that the strong momentum will continue at the beginning of the week. There will be PCE inflation data at the weekend. After the trade war, there has been no significant increase in price levels. If the PCE still shows mild inflation, the Federal Reserve may accelerate the pace of interest rate cuts to support gold prices. How to view the market situation? We can refer to each other.
2025-05-19
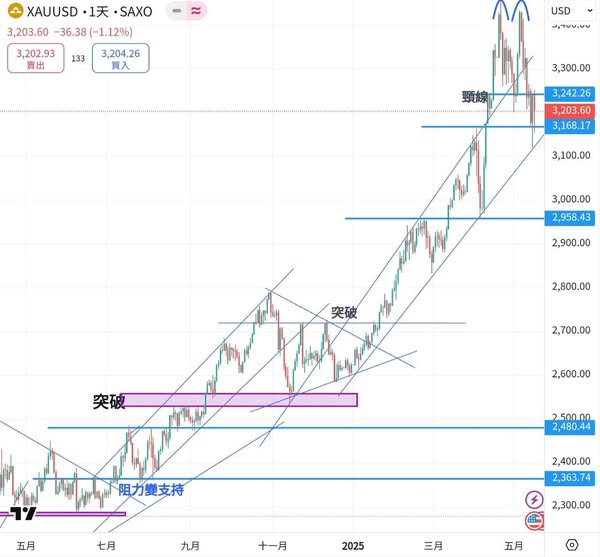
The tariff war between China and the US has seen a turn for the better, weakening the safe-haven function of gold. The gold price once plunged to a low not seen in over a month. Although there was some support from bargain hunters at lower levels, the technical outlook still seemed unsatisfactory. The unidirectional upward trend has changed, and the market may experience volatility in the future. At the beginning of the week, gold opened lower with a gap. The talks between China and the US in Switzerland showed a good atmosphere and consensus was reached on major issues. Unlike in April, there was no confrontation. Gold opened at 3286 on Monday and rebounded briefly but failed to stabilize above 3300. Gold prices have been hovering around the lowest point of the month, mostly fluctuating below 3,260. Due to the break below the monthly low, selling pressure once expanded the range. The inflation data released by the United States indicated that inflationary pressure was only moderate, which itself provided room for the Federal Reserve to cut interest rates. However, as the pressure from the trade war has eased, the market has reduced its expectation from a one-percentage-point cut by the end of the year to a half-percentage-point cut. Therefore, gold prices were only supported by bargain hunting during the week and failed to turn the decline into an increase. On the other hand, the decline in geopolitical risks has also reduced the demand for gold. US President Trump's visit to the Middle East, the prospect of a US-Iran agreement easing the disputes in the region, and the resumption of peace talks between Russia and Ukraine have all weakened the safe-haven function of gold. The gold price has repeatedly fallen below the 3,200 mark and narrowly held onto 3,203 at the close of the weekend. Looking ahead to this week, there are not many economic data releases in the US. However, the US-Iran agreement and the Russia-Ukraine peace talks are expected to cause market volatility. Technically, gold formed a double top at 3430 and broke through the neckline last week. The rescue rally failed to return above the neckline, indicating an unfavorable trend. The measured range...
2025-05-15
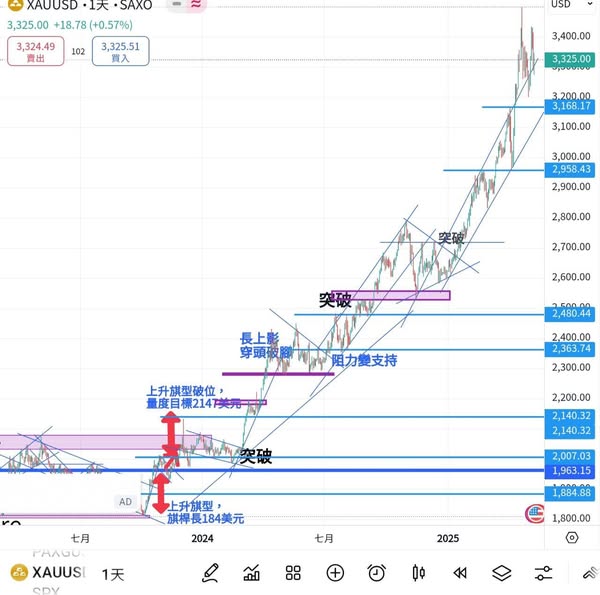
Last week, the gold price continued to soar under the influence of global tariff policies. The market was highly sensitive to trade war news. Even the slightest movement had already caused hot money to flow rapidly. As a safe-haven currency, gold was particularly favored by the investment market. Therefore, during this sensitive period, the fluctuation range of the gold price also doubled. At the beginning of the week, the Trump administration announced that it would impose a 100% tariff on overseas-made films, reigniting trade disputes. The US aims to bring film production back to its home soil, but this move is not well-received by the market. Investors believe that it exerts pressure on the US film industry, and market risk sentiment has soared. Gold prices rapidly broke through the 3300 mark at the opening of the market, rising by another 100 dollars to a peak of 3435 dollars, and then awaits the Federal Reserve's interest rate decision. The market had long expected that the interest rate decision at this meeting would not involve a cut. However, Chair Powell made it clear that the Federal Reserve would be patient and not rush to cut interest rates, responding coolly to the pressure from Trump for an immediate rate cut. The Federal Reserve's willingness to keep interest rates high has put pressure on the high gold price. Gold has started to lose stability above 3,400. On Thursday, news emerged that the UK and the US reached a trade agreement, with the US maintaining a 10% tariff and the UK increasing its purchase of Boeing equipment and removing tariffs on some US products. Signs of compromise in the trade war led to a decline in gold prices. Additionally, Chinese Vice Premier He Lifeng will hold talks with US Treasury Secretary during his visit to Switzerland, raising market expectations for a trade war easing. Gold prices dropped from above 3,400 to as low as 3,274 dollars, and then rebounded with the support of bargain hunters. The price closed at 3,325 dollars for the week, rising by more than 2% for the week. Looking ahead to this week, it is believed that this informal meeting between China and the United States may not lead to an immediate agreement. However, if the atmosphere of the talks is relaxed, it still has the potential to ease market tensions. Conversely, it could further panic the market. In addition, the US will also release inflation data during the week. Although the last inflation data did not show significant upward pressure, imports and orders have nearly plummeted, which is bound to affect the price level. If inflation remains high and the labor market does not weaken, the Federal Reserve may be more patient in maintaining high interest rates, which will put pressure on gold prices. How do you see the market situation? Let's share our views.
2025-05-07
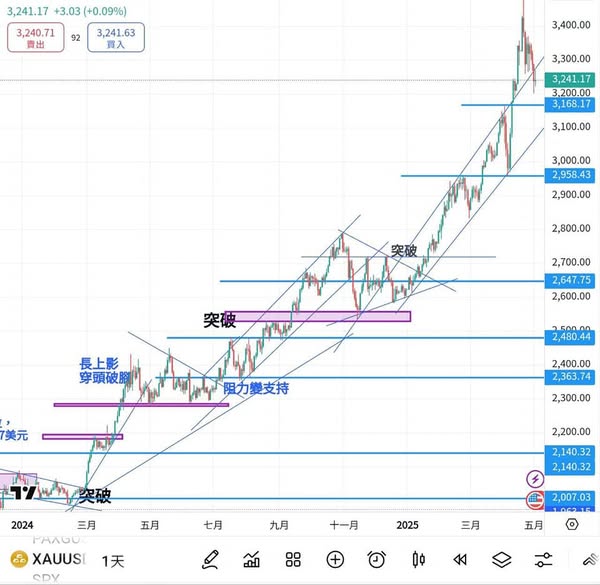
Since hitting a historical high of $3,500, gold has been fluctuating and giving back gains. Last week, it finally fell below $3,300. However, the decline was not one-sided but rather a zigzagging descent, with three steps down followed by two steps up. Despite this, there was still considerable buying interest in the market, which supported the rebound of gold prices. At the beginning of the week, the gold price still attempted to rebound. It managed to hold at 3,300 and once rose to 3,352, but failed to advance further. The rebound high on Monday was also the highest point of the entire week. It is believed that if the next wave is to resume its upward trend, it must break through this level and stabilize to confirm the return to an upward trajectory. With no further news of a tariff war between China and the US, the safe-haven function of gold has been slightly weakened, thus it tends to give back gains. Even though the ADP employment report in the US was lower than expected in the middle of the week, gold did not rebound and lost the 3300 mark. It dropped to 3200 on Thursday before starting to rebound. Before the release of the non-farm payroll, gold had already risen above 3260, indicating that there is still considerable buying power for low-price purchases. The U.S. released non-farm payroll data that exceeded expectations. Gold prices once again declined. The labor market was not too weak, reducing the risk of recession and easing the pressure on the Federal Reserve to accelerate interest rate cuts. This pushed gold prices down. However, it was no longer capable of challenging the 3200 mark. On Friday night, gold prices were seen fluctuating within a narrow range without any breakthrough. After the gold price retreated from 3500, it has started to attract bargain hunters at lower levels, and there is a greater chance of consolidation. There are not many economic data this week. The Fed will hold an interest rate meeting in the middle of the week, and it is expected that the interest rate will remain unchanged. Recent economic data have been slightly weak, but inflation has also eased. It is believed that the Fed still has considerable room to cut interest rates before the end of the year, which will provide some support for the gold price in the medium term. The post-meeting statement and press conference of the Fed after the interest rate meeting on Wednesday are expected to offer more clues about interest rates. For market outlook, it might be helpful to refer to each other's views.
2025-04-29
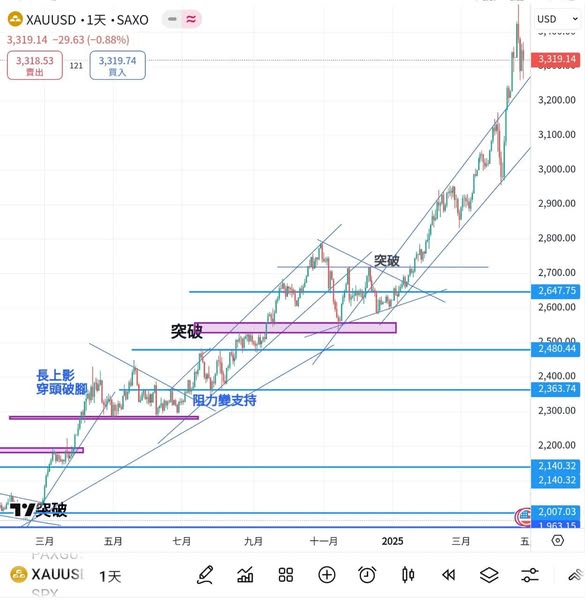
After the Easter holiday, the gold price was in full swing. It broke through the 3,400 mark again as soon as the market opened on Monday, rising by over 100 dollars compared to the previous week. The market momentum was strong. Investors' risk appetite was quite high. Any slight movement would attract funds to rush into the gold market for safety. Trump pressured Fed Chair Powell to cut interest rates, saying he was too late. The market was worried that Trump would fire Powell, affecting the independence of the Fed. The safe-haven function of the US dollar and US bonds had been reduced. Gold was sought after to 3,500 dollars, setting a new historical high. Later, it gave back some gains. Trump said he has no intention of dismissing Powell. Coupled with The Washington Post citing US officials as saying that tariffs on China are expected to be reduced to 60%, the news also coincided with the gold price giving back gains, hitting a low of $3,259 midweek. It rebounded after approaching the rising support line and has been fluctuating and consolidating at the high end. At this stage, the gold price's range has expanded, and the ups and downs have been fast, providing more opportunities to enter the market. Looking ahead to this week, the US will release data from the Department of Labor. The recent non-farm payroll performance has been decent, and the US economy is not too weak. The Federal Reserve has a relatively low chance of cutting interest rates, which may trigger a pullback in the gold market. However, under the shadow of the trade war, each pullback is an ideal opportunity to enter the market. Let's take a look at the market situation and refer to each other.


