
 en-US


 Telegram
 WeChat


2024-01-02
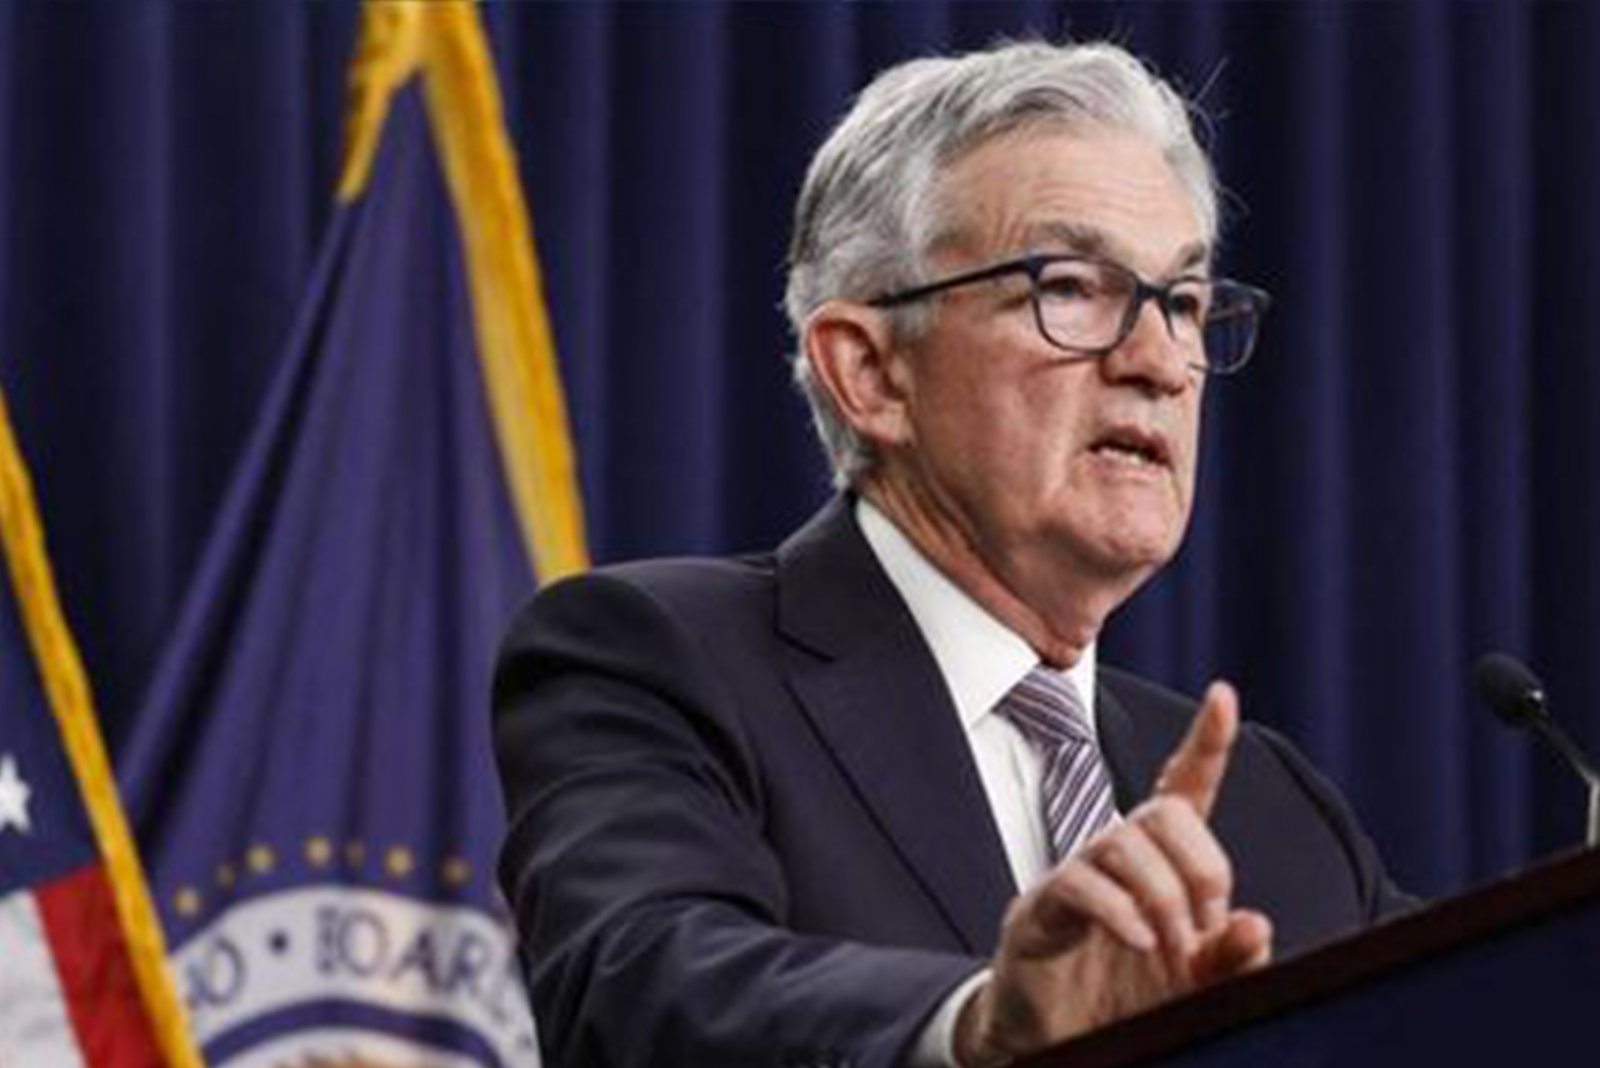
Cut interest rates in 2024? Jerome Powell, chairman of the Federal Reserve, said earlier that the interest rate hike may have been completed, but other Fed officials gave different answers on when it might start to cut interest rates. Who should decide the Fed to cut interest rates? The Fed has a mechanism to discuss interest rates. It is not up to one person to decide how much to increase or decrease interest rates. It is the Open Market Committee (FOMC) under the Federal Reserve that is responsible for negotiating interest rates, but 12 of them are responsible for deciding interest rates. 12 people with voting rights Federal reserve chairman Vice chairman of the federal reserve 5 executive members Federal Reserve Bank of new york 4 voting seats (The remaining 11 regional Federal Reserve Bank presidents rotate annually) President of the Federal Reserve Bank of the Non-voting Region Will still attend the FOMC meeting Participate in discussions, contribute opinions and provide reference. Forecast the views of future interest rate hikes and gather them into a bitmap. If an official with voting rights makes a speech, it is more worthy of attention.

2023-12-26
At the end of 2023, the overall economy or international politics in 2023 has undergone drastic changes, which have had an impact on the stock exchange and derivative financial products in the financial market. Let's review the three major events in 2023 together. Chat GPT detonated the concept of generative AI. The upsurge of artificial intelligence concept has led technology giants to launch a series of large-scale models one after another. OpenAI released ChatGPT-4 and GPT-4 Turbo. Google launched a new generation of large-scale language model PaLM2. Facebook launched DialoGPT Plus. Meta introduced a brand-new large-scale language model Llama. China's mainland technology giants have also triggered a competition called "Thousand Models War". Alibaba released a thousand questions about Tongyi Baidu launched ERNIE Bot. Tencent released a mixed model and so on. The popularity of ChatGPT-related concept stocks soared. Us dollar interest rate hike triggers banking crisis. On March 10th, 2023, Silicon Valley Bank (SIVBQ) suddenly declared bankruptcy, and its share price dropped from US$ 160 to US$ 0.2. The news that it was finally forced to withdraw from the market triggered global concerns about the survival of the banking industry and a crisis of confidence. Two days later, another well-known bank, Signature Bank(SBNY), also declared bankruptcy. Four major financial institutions, including Bank of America, Morgan Stanley, Citigroup and Wells Fargo, suffered losses of $52 million. The banking crisis gradually spread in mid-March. Credit Suisse, a veteran financial giant, was finally acquired by UBS at a price of 50% off and a "cheap price" of $3 billion. Share prices of European banks such as BNP Paribas and Deutsche Bank also fell. Bankruptcy of banks has caused great losses to the accounts of ordinary people, and these events have also sounded the alarm for financial regulators. The Palestinian-Israeli conflict is heating up, and the price of gold and oil is rising. The largest Palestinian-Israeli conflict in the past 20 years, followed by sharp fluctuations in international oil prices, the price of safe-haven assets gold rose, the Middle East stock market once fell across the board, while US military and energy stocks rose sharply. After the Russian-Ukrainian war, this conflict brought new uncertainties to global stability, and market confidence was hit, which led to the rise of risk aversion. In Europe and the United States, where stock markets generally fell, military and energy stocks rose against the market. At the same time, the long-term interest rate of American bonds soared and the price of gold with safe-haven properties began to rise again.

2023-12-19
When the interest rate hike cycle comes to the end, the market usually starts to expect the interest rate cut, and people expect that the economy will have a beautiful period of moderate growth, low interest rate, low inflation and low unemployment rate, that is, the blonde girl economy. What is the blonde economy? Goldilocks Economy is an economic term derived from fairy tales, which refers to moderate economic growth, low unemployment rate, low inflation and low interest rate during this period. At this time, not only the real living standard has improved, but also the performance of the financial market usually shows a moderate and stable increase, so investors will expect the blonde girl's economic period to be as long as possible. Economic conditions of blonde girls Low and mild inflation Low and sufficient interest rate level Low unemployment rate Steady growth of GDP The rise in asset prices Is the blonde economy a good phenomenon? Goldilocks economy symbolizes the slow growth of the economy. With appropriate economic data and monetary policy, it is the investment opportunity that many investors dream of. In fact, growth is only a thin line from economic recession, and it is easy to make the economy step into recession due to unexpected events or policy mistakes. Therefore, we should pay close attention to the trend of economic data. Be prepared for danger in times of peace so as not to be deceived by the unpredictable financial market!

2023-12-12
Data information is an indispensable factor in fundamentals. Investors will use financial calendars to pay attention to the economic performance of countries, and the development of data will be a major guide for future investment. What does the financial calendar contain? How does it help investors? Most financial calendars contain the following information and functions: Future and past economic events and indicators in most major countries Data release and time Data importance Actual value, Forecast value and Previous value of the data. Need to pay attention to: Most investment markets pay attention to the gap between the predicted value and the final result of the data, rather than comparing it with the previous result. Less important data often does not have the expected value. The expected value will be inconsistent in different financial calendars. Because the expected value in the market belongs to survey statistics, it is an interval set by economists and market participants, and different calendars may take different median values as reference. How does it help investors? Increase profit opportunities When investors trade at this time because of the fluctuation caused by data, they can increase their profit opportunities, but the corresponding risks are essentially equal. Hedging effect For conservative investors, financial calendars can be used to avoid risks. For example, try not to trade before the release of heavy economic data, or try to take profit and leave before the release of data. Using past data to predict future trends Tracking the data changes in the past few times can also view the detailed basic statistics and predictive function of the data. There is also a financial calendar on Mingde website. It is also printed with the 2024 financial calendar for free collection. (Limited quantity while stocks last) Help investors to be "risk-proof" and "preemptive"

2023-12-05
In the American market, investors often hear the "four witch days curse". It is said that the stock price will drop sharply every four witch days. Is this true? What exactly is Four Witches Day? What is the impact on investors? What is Four Witches Day? "Four Witches Day" is Quadruple witching day in English. It has four days every year, which is the third Friday in March, June, September and December in the US market, and the last Four Witches Day in 2023 is on December 15th. During the four witch days, the market price will fluctuate greatly because of the "settlement date" of derivative financial products in the American market. The derivative financial products settled are: stock index futures, stock index options, individual stock futures and individual stock options. Impact on the market? It is also because the above four kinds of derivative products are due, so investors in the market need to close their positions, or switch positions to contracts with further maturity dates, which also causes the week of four witch days, so the market transactions will be very hot, the fluctuations will be more intense, and the trading volume will be much larger. Impact on investors? According to the historical experience, the Four Witches Day has no obvious influence on the long-term price, so long-term investors need not worry too much, but short-term traders must pay special attention to the situation of the Four Witches Day, especially in the week after the Four Witches Day, the fluctuation of the US stock market will be more intense, providing more profit space and higher operational risks. The stock price fell sharply on the fourth witch day? The historical trend chart of S&P 500 in recent years shows that the trading volume increases greatly every four witch days, but it does not mean that the stock price index will perform better. According to statistics, the rising probability of each index is usually higher in the week before the four witch days. However, after the end of the four witch days, the decline probability of each index will also increase.
2023-11-29
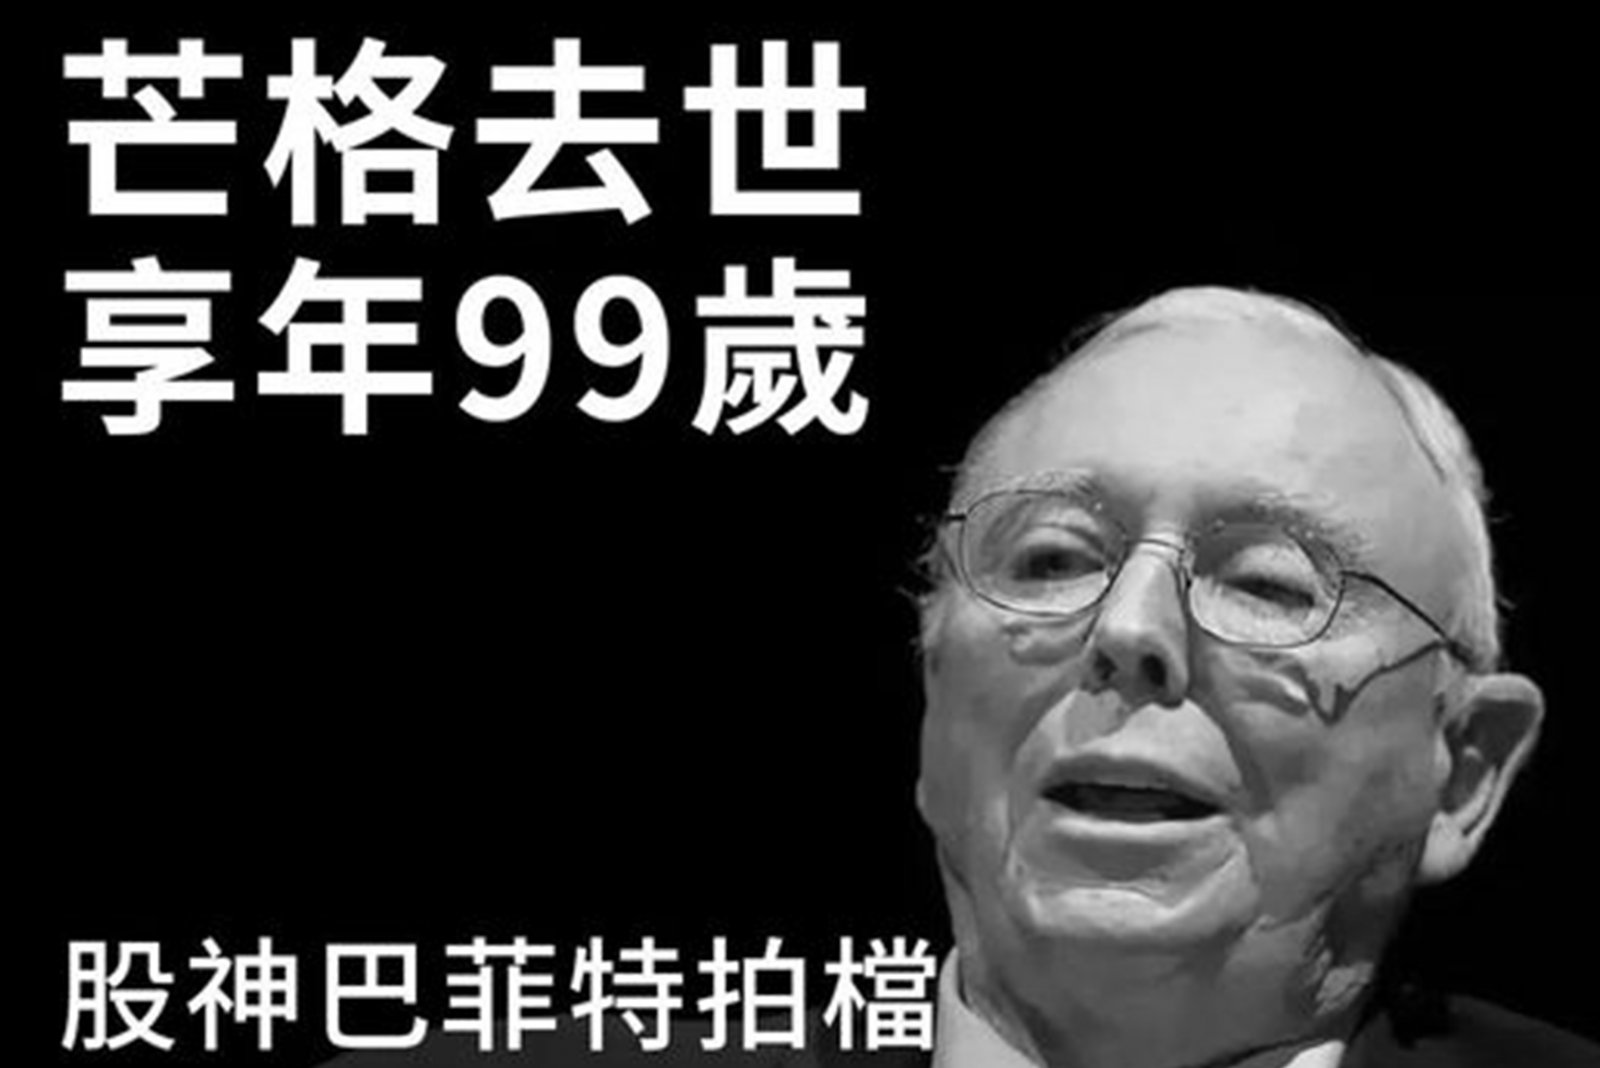
Charlie Munger, Warren Buffett's good partner and vice chairman of Ba County, died peacefully in a hospital in California at the age of 99. Buffett issued a statement mourning his friends, saying that without Munger's inspiration, wisdom and participation, Ba County could not have reached today's high position. Munger's remarks not only inspired Buffett, but also wrote books on investment and educated countless investors. Born on January 1, 1924, Munger was seven years older than Buffett. When he was young, he worked in Buffett and Son, a grocery store run by Buffett's grandfather. Munger and Buffett met in 1959 and became best friends. With Buffett's cooperation for many years, Ba County has become an investment flagship, with a market value of 780 billion US dollars and a share of more than 540,000 US dollars, which is a family heirloom of investors. Forbes estimates that Munger's net worth is $2.5 billion, and Buffett's wealth is $117 billion. Munger left many aphorisms that with enough models, 90% of the world's problems can be solved with design. His motto is also full of financial wisdom. He once said: "People with character will take cash and do nothing. I can achieve today because I am unwilling to be mediocre. There are two kinds of mistakes in life, one is doing nothing, and the other is choosing something beautiful in a pile of things to buy. "

2023-11-28
The Organization of Petroleum Exporting Countries and its allies (OPEC+) will hold a meeting on November 30th, and each meeting will have a significant impact on the global crude oil market, so it has attracted the attention of investors. What is OPEC? OPEC refers to the Organization of Petroleum Exporting Countries (hereinafter referred to as Oil Group). Its founding members are five major oil exporting countries. Up to now, it has developed into 13 member countries. In 2021, OPEC's combined crude oil production accounts for about 33.1% of the global total, and its crude oil reserves account for about 71.8% of the world's proven crude oil reserves. Among them, Saudi Arabia has the largest output and has a greater say. What is OPEC++? OPEC+ refers to the organization of oil exporting countries and some non-member crude oil producing countries, including 10 non-OPEC members. OPEC+ crude oil production accounts for 64% of the world. Thus, OPEC+ controls most of the world's crude oil production, while OPEC+ aims to adjust oil supply and price through coordinating policies. How does OPEC meeting affect oil prices? The goal of OPEC is to control oil prices by adjusting supply. If member countries are interested in raising oil prices, they can reduce production quotas to limit supply. On the contrary, if they want to reduce the price of oil, they can raise the production quota to increase the supply. Assuming that demand remains unchanged, oil prices will move in the expected direction. Although OPEC can only affect oil prices, oil prices are implicated in enterprise production and people's living costs, which in turn has a major impact on the economy. Therefore, every OPEC production reduction meeting deserves everyone's attention!

2023-11-21
KD indicator, also known as "random indicator", is composed of KD values and is one of the common technical analysis tools. It is often used to present the strength trend of the price, judge the relative level of the current price, and use KD to find the turning point of the price and find out the right time to enter and exit! K value: fast average, also known as "fast line", is sensitive and fast. D value: slow average, also known as "slow line", with slow response. Want to use KD value to judge the price trend, looking for a turning point, can be roughly divided into the following six situations: KD value > 80: The target is located in the overbought area, and the price performance is quite strong. KD value < 20: The target is located in the oversold area, and the price performance is quite weak. K value > D value: the target is in a rising market, which is suitable for partial operation. K value < D value: the target is in a falling market, which is suitable for short operation. KD Golden Cross: That is, when the K value breaks through the D value from bottom to top, it is a signal that the low point begins to reverse upward, so it is advisable to buy more. KD death cross: that is, when the k value falls below the d value from top to bottom, it is a signal that the high point begins to reverse downward, so it is appropriate to sell and go short. KD advantage Can quickly respond to price changes. Compared with other technical indicators, it is simpler. More accurate than the moving average KD defect Short-term variation and much noise. Easy to operate too frequently. Blind spots are produced during passivation. Investors should operate KD indicators with other technical indicators or fundamentals, and should not rely entirely on a single indicator.

2023-08-29
The Federal Reserve's meeting on interest rates in September is just around the corner. Investors are most worried about the rapid interest rate hike in the United States, which will lead to a "hard landing" of the economy and impact the economy and investment market. What are the hard landing and soft landing that we often hear recently? Soft landing refers to: After adjusting the monetary policy moderately, the economy returned to the moderate growth range moderately and steadily, and there was no large-scale unemployment or economic recession in the process, just like the plane slowed down and landed slowly. Although the interest rate hike did harm to the economy, the damage was not great, and the overall economy still held on to growth. The flatter the downward trend, the more ideal the soft landing would be. A hard landing means: The use of strong monetary policy tightening means to reduce communication leads to a rapid decline in economic growth, accompanied by a decline in people's income and unemployment, just like a plane landing at high speed. Simply put, the hard landing is due to poor economic health or excessive interest rate increase, which leads to more severe economic damage! Definition of soft and hard landing (Federal Reserve of new york, USA) "Soft landing": The annual economic growth rate has remained positive in four quarters in the last 10 quarters. "Hard growth": In the next 10 quarters, the annual economic growth rate will be-1% or less. At the same time, American officials will use DSGE model to predict soft and hard landings. In December 2022, the Federal Reserve Bank of New York predicted that the average GDP in the next four years will be mostly positive, and the chance of soft landing is high.

2023-08-22
Jackson Hole What is the annual meeting of global central banks? The annual grand meeting held by the Kansas City Fed in late August in Jackson hole, Wyoming, is a unique central bank meeting in the world, bringing together central bank presidents, Nobel laureates in economics, central bank officials, private economists, financial market participants, scholars, government officials and media practitioners. People get together to discuss important long-term policies. Jackson Hole Conference in 2023 The theme "Structural Transformation of the Global Economy" will be held from August 24th to 26th. Federal Reserve Chairman Powell will deliver a speech on economic prospects at the meeting at 10: 05 am local time on August 25th. What is the impact on the market? Different from the closed activities of the general central bank, media reporters attend the meeting together all the time and report the first-hand news, so that the world can immediately grasp the conference dynamics and expand the influence of the conference. All previous meetings have triggered a series of fluctuations in the stock market, debt market and commodities, so they have attracted the attention of global investors.

2023-08-15
Economic trends are unpredictable and changeable. We can still try our best to grasp the future economic trends through "leading indicators". What are the leading indicators? Leading Economic Indicators, also known as leading indicators, mainly predict the future prosperity direction and economic performance, and their data are not only good or bad. Representing the economic trend of the United States itself will also affect the global economy. By observing the trend of leading indicators, investors can take the lead before the economy changes. Seize the opportunity LEI (commonly referred to as LEI) is compiled by 10 leading economic indicators in the United States, some of which are different from the actual economy. Indicators show a reverse change relationship. Only by knowing which data the change is caused by can we correctly judge the future trend of the economy. The 10 indicators are: 1. Average weekly working hours of manufacturing employees 2. Number of new recipients of unemployment benefits 3. New manufacturing orders–consumer goods and related raw materials 4. New orders for manufacturing industry–excluding non-defense capital assets of aviation. 5.ISM new order 6. Building Permit-Number of new private housing units 7.S&P 500 stock price index 8. Leading credit index 9.10-year U.S. debt and federal funds interest rate spread 10. Average expectations of consumers for future prosperity Most of the indexes included in the leading indicators reflect the source of the economy, so they can predict the trend of the economy. Of course, the leading indicator is definitely not It is completely accurate and cannot be completely relied on, but it can be used as an auxiliary basis for investment decisions.

2023-08-08
Head-and-shoulder shape appears most in the chart shape, because both sides have been wrestling for a long time and the momentum of one side has gradually become clear, so it is a reliable reversal breakthrough shape. There are two types: head and shoulder top and head and shoulder bottom. head & shoulders top It consists of three different tops: the left shoulder, the head and the right shoulder, and the supporting position is connected in a line to form the neckline. The left shoulder has the largest turnover, followed by the head, and the right shoulder is thinner. When the price falls below the neckline, there will generally be a sharp and large decline. head andshoulders bottom It is the inversion of the top of the head and shoulders, and consists of three different bottoms: the left shoulder, the head and the right shoulder. The resistance position is connected into a straight line, which is the neckline. When the price rises above the neckline, there will generally be a strong increase. The vertical distance from the head to the neckline measures one to three times the height of the increase/decrease after the breakthrough.

2023-08-01
Flag-shaped, fluctuating market entry strategy Flag shape means that the price rises or falls sharply (flagpole) first, and then walks a short-term ascending or descending track (flag body) in the opposite direction. The shape is like a flag, which is divided into an ascending flag shape and a descending flag shape: Flag-raising shape When the price rises sharply (forming the flagpole position), a new dense area appears again. Connect the high and low positions of the dense area respectively and draw two parallel and downward inclined straight lines, which will form the flag-raising shape. When the grid price breaks through the dense area, it is a good opportunity for friends to enter the market. falling flag When the price drops sharply (forming the flagpole position), an upward-inclined dense area appears, which is the descending flag shape. After the flag appears, the price falls through the dense area, which is a good time for Danyou to ship. According to the height of the flagpole, the rising/falling range can be measured, so as to set the goal!

2023-07-25
The strength of the US dollar index has a wide influence. The factors that affect the US dollar index are roughly as follows Hedge demand For example, in the short period after the FED raised interest rates/the Black Swan incident occurred in the global economy, funds would quickly flood into US dollar assets to hedge, resulting in a short-term surge in the US dollar index. Raw material demand The price of raw materials (such as gold and crude oil) is denominated in dollars, so when the dollar rises, the price of raw materials will fall, and vice versa. Foreign exchange reserves of central banks (in US dollars) When the demand for foreign exchange reserves in dollars rises, the dollar index will rise, and vice versa. Comparison of economic growth between the United States and other countries; Especially in the euro zone, the euro is the largest component currency of the US dollar index. When the economic growth of the United States is stronger than that of the euro zone, funds will be transferred from the euro zone to the United States, which will strengthen the US dollar and devalue the euro. FED interest rate policy When the United States raises interest rates, in order to pursue higher returns, it will attract overseas capital inflows, thus pushing up the dollar.

2023-07-18
What is the dollar index? The US Dollar Index, DXY) is an indicator to observe the trend of the US dollar against the world currencies, and the exchange rate of the US dollar against other major currencies in the world is used as an indicator to calculate. It can reflect the strength of the dollar itself. How to interpret the dollar index? The value of the US dollar index is not the price of the US dollar, nor the exchange rate, but the degree of rise and fall relative to the base of 100. Assuming that it rises from 100 to 120, it means that the US dollar has appreciated by 20% relative to the six currencies during this period, which means that the US dollar index has strengthened. And vice versa. How to affect the global market? International trade price At present, the US dollar is a global currency, and most international commodity transactions need to be bought and sold in US dollars, including gold and crude oil. Therefore, the trend of the US dollar also affects the prices of gold, crude oil and dollar-denominated trade commodities. Affect the exchange rate of various countries When countries exchange money, they often change it into dollars first and then into dollars. From the change of the US dollar index, we can also quickly see the changes of other countries relative to the US dollar.

2023-07-11
The fluctuation range of prices in dense areas becomes narrower and narrower, and gradually loses elasticity. The trend line will form a triangle. When it enters the tip of the triangle, it means that the consolidation stage is over. There are three forms of triangle: Symmetrical triangle price is formed by two convergent trend lines with similar angles. Ascending triangle The price consists of a resistance horizontal trend line and a rising support trend line. descending triangle The price is formed by a horizontal support trend line and a downward resistance trend line. Admission/exit trading opportunities: When the price hits the top and falls back, it is an opportunity to sell. When the price hits the bottom and rebounds, it is an opportunity to buy. When the price breaks above the triangle, it is an opportunity to buy. When the price breaks below the triangle, it is an opportunity to sell. note: The rising triangle most often appears on the way to the market, which is a favorable finishing form; The falling triangle mostly appears on the way down, which belongs to the consolidation form of profit and light. When you reach the tip of the rising triangle and make an upward breakthrough, it is the end of the finishing pattern, and you can enter the market immediately. The goal is the height of the triangle after the breakthrough.

2023-07-04
Federal Reserve Chairman Powell often stressed that "the central bank is firmly committed to the goal of restoring the inflation rate to 2%". Why is it a "2%" inflation rate? When the inflation rate is higher than 2%, people's money will depreciate rapidly, which will affect people's living standards. However, if the inflation rate is too low, the possibility of falling into deflation will increase and the risk of economic recession will increase. Moderate inflation can encourage enterprises to invest, create a stable employment environment and promote sustained economic growth. Members of the Federal Reserve have also said that 2% is the best way to meet their two requirements of "price stability" and "employment maximization", and these two requirements are in line with the orders given to them by Congress. Before 2020, we have been pursuing the "symmetric inflation goal of 2%". This means that when the market data shows that the inflation rate exceeds 2%, monetary policy will tend to tighten, and vice versa. After 2020, it will be changed to Average Inflation Targeting. It is to tolerate inflation exceeding 2% for a period of time until the average inflation rate reaches 2% during this period. The adjusted policy goal can keep the market environment in an ultra-loose environment for a long time.

2023-06-27
The Federal Reserve will publish the latest bitmap and economic forecast after the interest rate discussion, and the market often uses bitmap to predict the pace of interest rate increase. What exactly is a bitmap? Each point in the bitmap represents a central bank governor's prediction of short-term interest rates. If the economy develops according to the expected path, the federal benchmark interest rate will be average in the next three years. Members will also provide a reference for the long-term interest rate, which stands for the so-called "neutral interest rate". The neutral interest rate represents the point where interest rates will neither stimulate economic development nor limit economic growth. The bitmap can let us know where the largest distribution is and FOMC members' views on the interest rate trend in the next few years, so that the market can bring enlightenment to the future interest rate. There are blind spots in bitmap. These points are anonymous, and no one knows which member is which point. In addition, the Federal Reserve rotates voting members every year, so not all members have the right to vote, so it is impossible to judge from the bitmap. Assuming that most members think that the interest rate will rise to a higher range, but they do not have the right to vote, and those members who have the right to vote are not expected to be so radical, the final result of interest rate discussion is likely to be more conservative. Attention of investors The market is changing rapidly, and people's expectations will change quickly. In addition, the bitmap is not a promise. With the change of economy and the development of financial market, the interest rate forecast will change at any time.

2023-06-20
After the meeting on interest rates, the Bank of Japan maintained an ultra-loose monetary policy. The yen's new low in seven months is certainly exciting for many Hong Kong people who are going to visit Japan, but why did the yen depreciate? There are three main reasons: monetary policy Under the influence of loose monetary policies such as QQE (quantitative qualitative monetary easing with negative interest rate) and YCC (yield curve control), a large amount of funds flowed to the market, which led to the important reason why the yen was easy to depreciate and difficult to rise in the past 10 years. margin For the foreign exchange market, one of the most important reasons that affect the strength of the exchange rate is the spread between the two countries. Since 2022, the FED has raised interest rates six times, with a cumulative increase rate of 375 basis points. The higher the interest rate in the United States, the more attractive the interest rate products will be, and more money will be attracted. However, Japan still hopes to maintain a loose monetary policy to promote inflation, which leads to the continuous widening of the spread between the United States and Japan and the depreciation of the yen. Capital flow direction CFTC will announce every week the investors' open positions in yen futures (Chicago and New York Futures Exchange) last week. If it is less than 0, it means that the market is generally bearish on the yen, and vice versa. Although the scale is not large enough to affect the trend of the yen, yen investors will use this data as a basis for operation, and then form an expected psychological impact on the future. Has the yen fallen to the end? We need to pay attention to whether Japan continues to be loose, whether the United States continues to raise interest rates, and whether the trade deficit increases.

2023-06-13
Since the beginning of this year, the yield curve of the United States has shown the most serious inversion in more than 40 years, and the market is worried that the economic recession is coming. What is debt interest upside down? Generally speaking, the longer the maturity of a bond, the greater the risk and uncertainty it bears, so the higher the bond interest rate will be. On the contrary, the shorter the maturity period, the lower the bond interest rate will be. When we reduce the long-term bond income from the short-term bond interest rate to less than zero, it means that "the bond interest rate is upside down". The market most often uses the spread between the yields of 2-year and 10-year US government bonds as the bond interest rate. Observation index of upside down. Earlier, the Federal Reserve published a study, which pointed out that they used the three-month period and Lebanon 10 years ago as a reference. It is worth mentioning that if these two figures are used as a reference, every time there is an upside down, there will definitely be a recession within three to eight quarters, which is extremely informative. Normal: long-term bond yield > short-term bond yield Abnormal: short-term bond yield > long-term bond yield A sign of economic recession? A few months after each debt-interest inversion, the American economy will experience recession. For example, in the internet bubble in 2000 and the financial tsunami in 2008, debt-interest inversion occurred, followed by a stock market crash and a great recession, which is why the market interprets debt-interest inversion as a signal of economic recession. How should investors respond? Assuming that this theory is still feasible, investors should be careful of the possible recession risks, pay more attention to asset allocation, and lay out more diversified assets. Gold with a safe-haven role is naturally a choice for many investors.